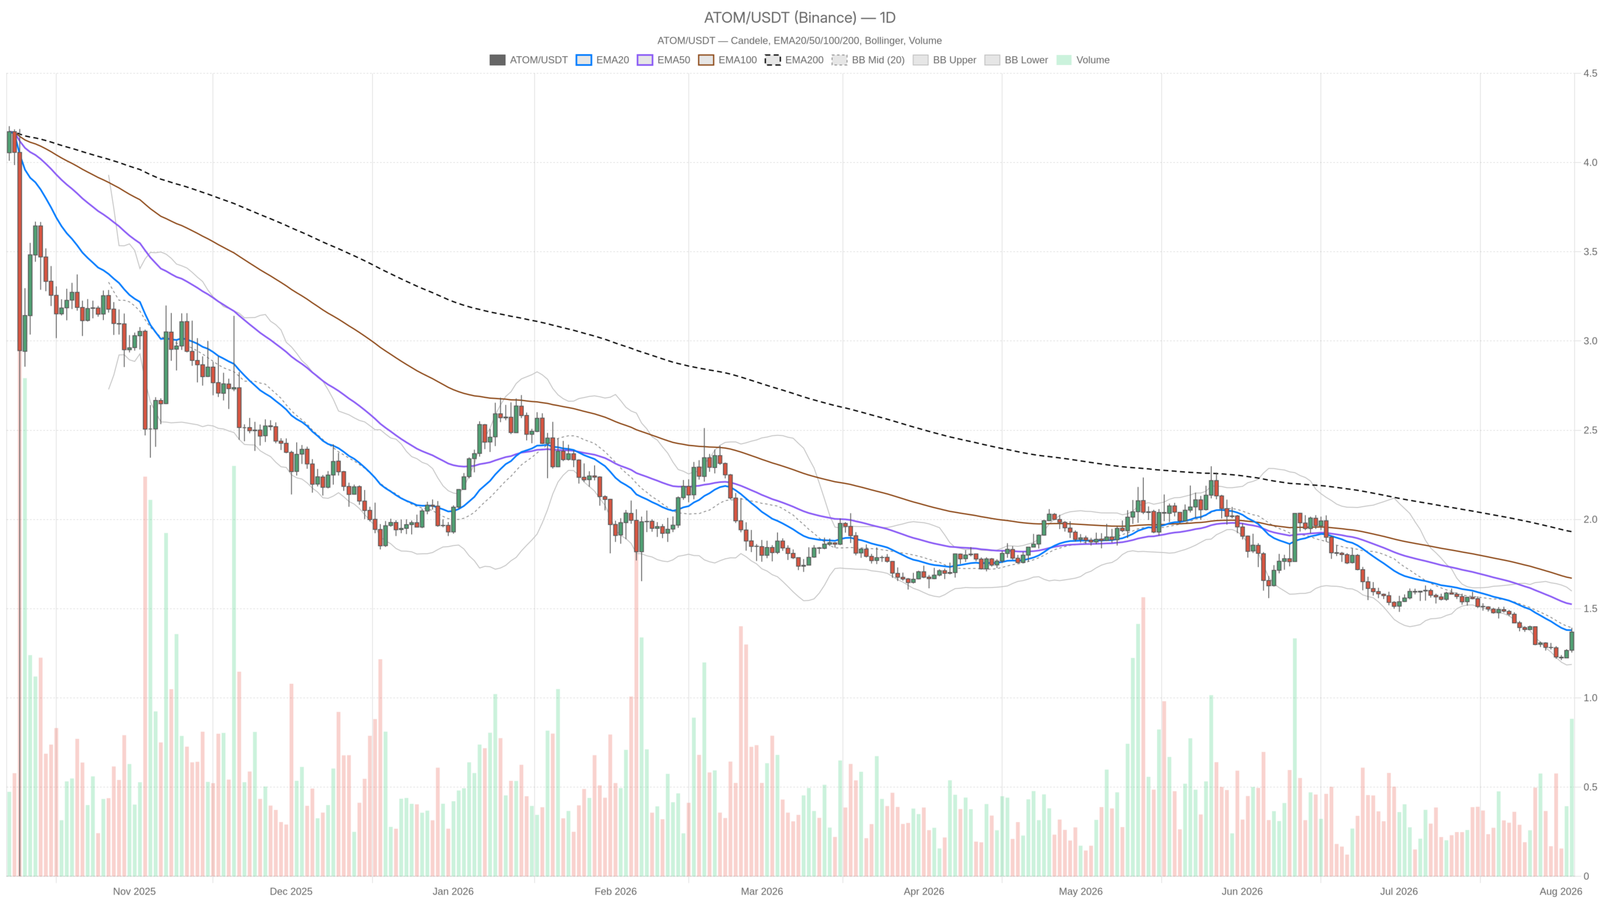
As of August 3, 2026, the Cosmos Hub crypto asset $ATOM trades near $1.37, caught between a bearish daily structure and an overbought short-term bounce. The conflicting signals across timeframes make the next few sessions decisive for near-term direction.
Key takeaways
- $ATOM trades around $1.37, below its EMA20, EMA50, and EMA200 on the daily chart.
- Daily RSI14 at 44.08 reflects indecision rather than strong directional conviction.
- The 1H RSI14 has reached 78.78, signaling an overbought condition on the short-term bounce.
- $BTC dominance near 56.4% and a Fear & Greed Index of 28 continue to weigh on altcoin momentum.
- Key levels to watch: resistance at 1.42 and 1.52, support at 1.28 and 1.19.
Daily Structure Still Leans Bearish
The daily chart for $ATOM remains in a bearish regime, with price trading below all three major moving averages. EMA20 sits at 1.38, EMA50 at 1.52, and EMA200 at 1.93 — a configuration that typically reflects prolonged de-rating rather than a short-term shakeout. The EMA200, sitting nearly 40% above spot, underscores how long the dominant downtrend has been in place.
Meanwhile, daily RSI14 registers at 44.08, sitting in a no-man’s-land that mirrors indecision more than conviction. MACD shows a line of -0.08 against a signal of -0.08, with a flat histogram at 0. Momentum has stopped accelerating downward, yet it has not flipped positive either. This kind of stalling often precedes either a breakdown or the early stages of a base-building process.
The Bollinger Bands — with a midline at 1.39, upper band at 1.60, and lower band at 1.19 — place price almost exactly at the center, consistent with a market that lacks strong directional momentum. Daily ATR of 0.05 confirms contained ranges rather than explosive moves. The pivot framework adds clarity: a pivot point at 1.34, resistance at 1.42, and support at 1.28. Reclaiming 1.42 would be the first hint that daily bearish bias is softening, while a slip toward 1.28 would confirm sellers remain in control.
Short-Term Bounce vs Long-Term Downtrend
The 1H chart, however, reveals a short-term recovery that clashes with the daily structure. $ATOM trades above its hourly EMAs — EMA20 at 1.32, EMA50 at 1.29, and EMA200 at 1.30 — all sitting beneath the current 1.37 price. Yet the hourly RSI14 at 78.78 sits deep in overbought territory, signaling the bounce has moved fast and may be running low on fuel. MACD on the hourly remains positive, with a line of 0.03 against a signal of 0.02 and a thin histogram at 0.01, confirming upward momentum exists but lacks power.
On the 15-minute chart, the regime reads bullish, with EMA20 at 1.36, EMA50 at 1.33, and EMA200 at 1.28 stacked correctly beneath price. RSI14 at 60.99 is healthier — bullish without being stretched — while MACD is flattening out, suggesting the micro-momentum that drove the bounce is cooling as price approaches the pivot cluster near 1.37. This is the textbook signature of a relief bounce inside a larger downtrend: worth respecting, but not something to confuse with a trend reversal.
Bullish and Bearish Scenarios for $ATOM
The bullish case for the Cosmos Hub crypto asset requires the daily EMA50 at 1.52 to be reclaimed and held, alongside a clean break above the daily R1 pivot at 1.42. If that materializes while lower-timeframe momentum stays intact, the next magnet becomes the upper Bollinger Band near 1.60 and eventually the EMA200 around 1.93 — though that is a significantly larger ask given the current distance from spot. This scenario gets invalidated quickly if $ATOM meets rejection at the 1.39–1.42 zone while the 1H RSI exits overbought territory, suggesting buyers could not convert the bounce into anything durable.
Conversely, the bearish case remains the path of least resistance, given the daily regime, the Fear & Greed reading of 28, and $BTC dominance above 56%. If $ATOM fails to hold the intraday EMAs and slips back below the shared pivot near 1.37, the next levels to watch are the daily S1 at 1.28 and, should pressure intensify, the lower Bollinger Band around 1.19. This bearish continuation would be invalidated by a daily close above the EMA20 at 1.38, accompanied by the daily MACD histogram turning positive — the first real technical evidence that sellers are losing their grip.
Positioning and Risk
With timeframes in open disagreement, patience emerges as the clearest signal. The daily downtrend remains unbroken, and the hourly overbought reading makes a pullback within the bounce unsurprising even if the broader recovery eventually continues. Volatility, as measured by ATR, stays moderate across timeframes, which means no panic but also no decisive range expansion of the kind that typically accompanies a genuine trend change.
Given the Fear-dominated sentiment backdrop and Bitcoin’s outsized share of total market cap, anyone tracking this $ATOM setup should treat the current bounce as unconfirmed until the daily chart actually shifts regime. Levels, not narratives, will determine the outcome — 1.42 and 1.52 on the upside, 1.28 and 1.19 on the downside remain the boundaries that matter until proven otherwise.
FAQ
What is the current price of Cosmos Hub ($ATOM)?
As of August 3, 2026, $ATOM is trading around $1.37, positioned below its daily EMA20 at 1.38, EMA50 at 1.52, and EMA200 at 1.93.
Why does $ATOM show conflicting signals across timeframes?
The daily chart remains bearish with price below all major moving averages, while the 1H and 15-minute charts display an intraday recovery with price above short-term EMAs. This divergence is typical of a relief bounce within a larger downtrend rather than a confirmed trend reversal.
What are the key levels to watch for $ATOM?
On the upside, resistance sits at 1.42 and 1.52, with the EMA200 near 1.93 representing a longer-term target. On the downside, support levels are at 1.28 and 1.19, the latter aligning with the lower Bollinger Band on the daily chart.
Disclaimer: This article is for informational purposes only and does not constitute financial advice, an investment recommendation, or a solicitation to buy or sell any financial instrument or cryptocurrency. The analysis provided is not indicative of future results. Investing in crypto assets and financial markets carries a high risk of capital loss. Always do your own research (DYOR) and consult a qualified financial advisor before making any decision.
Article produced with the assistance of artificial intelligence and reviewed by the editorial team.