
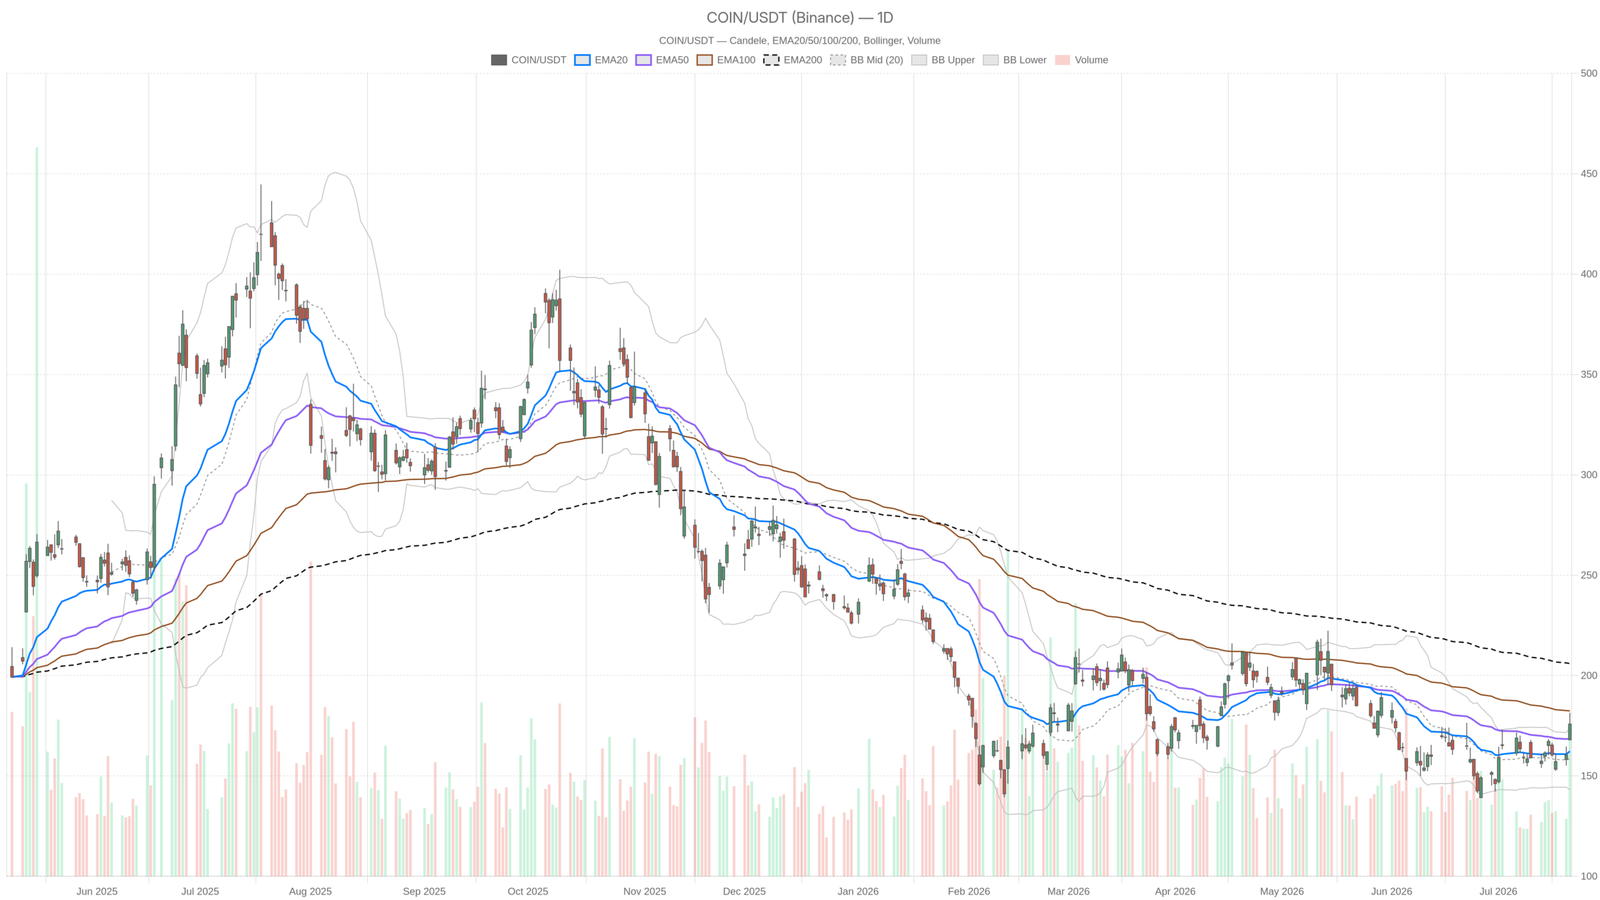
Coinbase stock surged roughly 11% on July 21 after the White House and Senate Republicans reached an agreement on the CLARITY Act. The rally reflects optimism around digital asset regulatory clarity. Yet the daily chart shows COIN still faces a significant technical ceiling above current levels.
Key takeaways
- COIN closed at $175.85 on July 21, surging roughly 11% intraday on the CLARITY Act catalyst
- The EMA200 at $206 sits well above current price, keeping the longer-term trend structurally bearish
- Daily RSI at 58.71 and a positive MACD histogram suggest momentum is quietly building without overbought conditions
- The hourly chart confirms an active bullish regime with all three key EMAs below current price
- Daily ATR of $10.16 reflects elevated volatility, making big daily moves the norm
Daily Bias: Recovery Mode, Not Yet Breakout
The daily chart for Coinbase stock reflects recovery mode — not yet a confirmed breakout. Price closed at $175.85 on July 21, above both the EMA20 at $162.29 and the EMA50 at $168.67. However, the EMA200 at $206 remains a distant ceiling, keeping the longer-term trend structurally bearish until that gap closes.
EMA Stack Reveals a Mixed Trend Structure
Price opened the session at $168 and printed a high of $181.49 — a wide-ranging candle. The ATR of $10.16 confirms daily volatility is elevated. At the same time, big moves are now the norm, not the exception.
The EMA stack reveals an important nuance. The EMA20 at $162.29 and EMA50 at $168.67 sit comfortably below current price. That signals price is pushing above its shorter-term trend anchors. In contrast, the EMA200 looms at $206, well above where COIN trades. The longer-term trend remains structurally bearish until that gap closes meaningfully.
Momentum Indicators Signal a Quiet Shift
The Bollinger Bands reinforce this picture. The midline sits at $158.58, with the upper band at $174.03. Tuesday’s close at $175.85 represents a breakout above the upper band — typically a sign of strong momentum. However, it can also indicate short-term overextension. Both interpretations deserve attention.
Daily RSI at 58.71 is constructive without being alarming. It signals momentum without screaming overbought. Meanwhile, the daily MACD line at -0.56 remains just below zero. However, the histogram has turned positive at 1.98, with the signal line at -2.55 still lagging. This crossover dynamic suggests momentum is quietly shifting upward — not confirmed, but building. The daily regime is classified as neutral. The bounce is real; the trend reversal is not yet validated.
Pivot Levels Frame the Next Test
Pivot analysis adds further granularity. The pivot point was $175.07, with R1 at $182.27 and S1 at $168.64. COIN closed just above the pivot and below R1. That is a constructive position heading into the next session. However, the stock must push and hold above $182 to begin opening the next leg higher.
Hourly Confirmation: The Bullish Regime Is Active
The 1-hour chart confirms an active bullish regime for Coinbase stock, with clean EMA alignment and expanding momentum. The H1 structure strengthens the daily recovery thesis rather than conflicting with it.
Price at the latest 1H close of $175.92 sits well above all three key hourly EMAs. The EMA20 is at $169.39, EMA50 at $164.93, and EMA200 at $163.92. This is a clean bullish EMA alignment on intraday structure. Notably, the EMA200 on the hourly chart sits far below current price, reflecting the magnitude of the recent leg higher.
The 1H MACD reinforces the bull case. The MACD line stands at 4.61, well above the signal line at 3.11, with the histogram at 1.50. Momentum on this timeframe is clearly positive and still expanding. Meanwhile, RSI at 64.8 confirms the trend is active without yet entering the danger zone above 70. Overall, the intraday structure is trending, momentum is behind the move, and the bulls retain control of the near-term tape.
15-Minute View: A Brief Pause After the Run
The 15-minute chart signals a brief consolidation phase after the surge, with short-term momentum fading into the close. This is execution context only — not a contradiction of the broader intraday trend.
On the 15-minute timeframe, the regime is classified as neutral. The MACD histogram has flipped negative at -0.96, meaning short-term momentum stalled into the close. RSI at 52.75 is mid-range and non-committal. The 15-minute Bollinger midline at $178.31 sits above current price. This suggests a brief pullback phase within the broader intraday uptrend.
Short-term traders saw momentum fade slightly in the final minutes of the July 21 session. That is not surprising after an 11% gap-and-run day. A consolidation or minor retracement near current levels would be a normal technical development before the next directional attempt.
The Bullish Scenario: Regulation Meets Momentum
The bullish case for Coinbase stock rests on a convergence of regulatory catalysts and improving technicals. A clean break above $182.27 would open the door toward higher resistance levels and validate the momentum shift underway.
The CLARITY Act development is not a minor footnote. Regulatory certainty around digital assets has been one of the single biggest overhangs for crypto-adjacent equities. If the legislation advances, COIN is among the most direct beneficiaries in the public market. At the same time, Coinbase announced expansionary plans for the Canadian market — signaling the company is playing offense, not defense.
On the chart, continued MACD line crossover into positive territory on the daily would validate the momentum shift. If the EMA50 at $168.67 holds as support on any pullback, the short-term uptrend structure remains intact. Notably, Raymond James initiated coverage of Coinbase stock with a Market Perform rating on July 21. That is not a ringing endorsement — but it places a new institutional voice on the name and could contribute to incremental positioning.
The Bearish Scenario: Overhead Resistance Is Real
The bearish case for Coinbase stock centers on the significant structural gap to the EMA200 and the risk of mean reversion after the upper Bollinger Band breach. The daily MACD line remains fractionally negative, keeping the momentum signal technically unconfirmed.
The EMA200 on the daily chart at $206 represents a gap of more than $30 from the close at $175.85. Recovering this level would require a sustained, multi-week push higher. The upper Bollinger Band breach on the daily chart also deserves respect. A mean reversion back toward the $158.58 midline remains a legitimate scenario if buying pressure fades.
Meanwhile, daily volatility is high — a $10 ATR means price can cover considerable ground in either direction. A deterioration in crypto sentiment, a stall in the CLARITY Act negotiations, or broader risk-off behavior in equities could quickly erase the session’s gains. Furthermore, the daily MACD line, still fractionally negative at -0.56, has not yet crossed into positive territory. Until it does, the daily momentum signal remains technically unconfirmed. The 11% gap higher also introduces the risk of a reversal if the fundamental catalyst fails to materialize fully.
Positioning and Volatility Outlook
Coinbase stock enters the next session in a decision zone, not a confirmation zone. The narrative is compelling, but the structure needs time to solidify.
The daily structure is improving but not yet definitive. On the other hand, the hourly chart is bullish, offering near-term directional confidence. The 15-minute chart flags a short-term cooldown after an exceptional run. Volatility remains the defining variable. With daily ATR above $10, the risk-reward calculus shifts dramatically depending on entry level and timing.
Therefore, the $168–$169 zone — where the EMA50 meets the prior open — represents a meaningful reference point for any pullback. Above $182, the daily pivot R1 becomes the next test. Traders and investors watching Coinbase shares should treat the current range as a decision zone. The narrative is compelling; the structure needs time to solidify.
FAQ
What is driving Coinbase stock higher?
The primary catalyst is the reported agreement between the White House and Senate Republicans on an ethics package for the CLARITY Act. If passed, the bill would resolve a major regulatory ambiguity around digital asset oversight, directly benefiting Coinbase stock.
Is Coinbase stock in a bullish trend?
The daily chart remains in neutral territory — the bounce is real, but the trend reversal is not yet confirmed. However, the hourly chart shows an active bullish regime with clean EMA alignment and expanding momentum. The longer-term trend remains structurally bearish until price closes the gap to the EMA200 at $206.
What are the key resistance levels to watch for COIN?
The immediate resistance sits at $182.27, which is the daily pivot R1. A clean break and hold above this level would open the door toward higher resistance. The EMA200 at $206 represents the major structural ceiling on the daily chart.
How volatile is Coinbase stock right now?
Daily volatility is elevated, with an ATR of $10.16. This means big daily moves are now the norm, and the risk-reward calculus shifts dramatically depending on entry level and timing.
Disclaimer: This article is for informational purposes only and does not constitute financial advice, an investment recommendation, or a solicitation to buy or sell any financial instrument or cryptocurrency. The analysis provided is not indicative of future results. Investing in crypto assets and financial markets carries a high risk of capital loss. Always do your own research (DYOR) and consult a qualified financial advisor before making any decision.
Article produced with the assistance of artificial intelligence and reviewed by the editorial team.