
Circle stock is caught between conflicting signals. A bearish daily chart clashes with constructive hourly and 15-minute timeframes after volatile earnings. CRCL closed the August 5 session at 63.28, recovering from a 59.12 low but falling short of the 64.20 intraday high.
Key takeaways
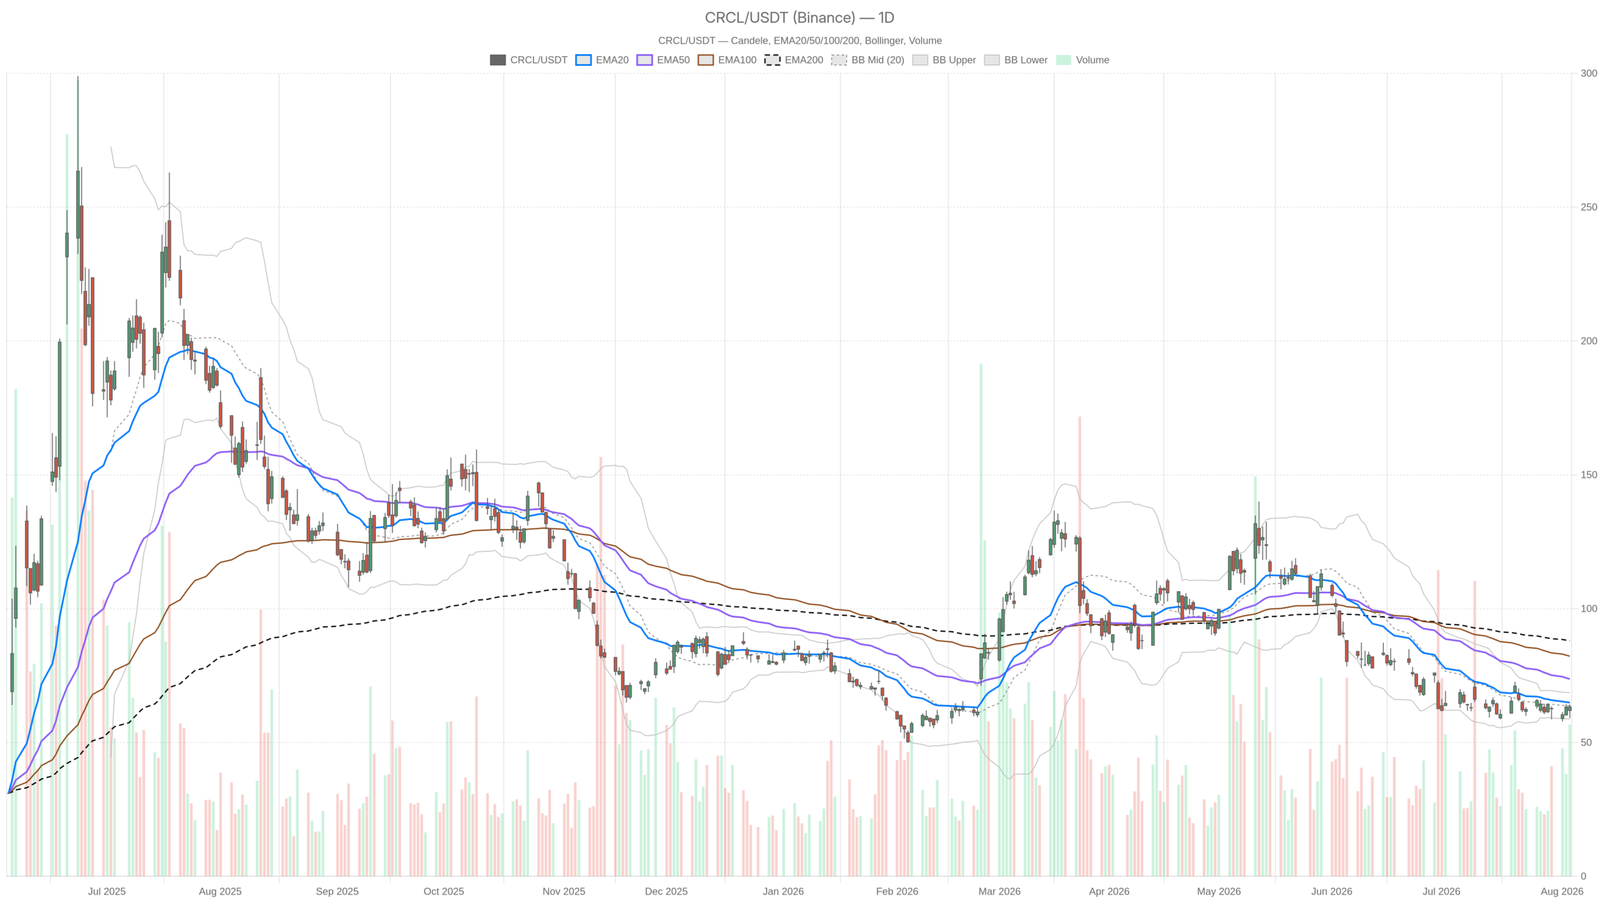
- The daily trend on Circle stock remains bearish with price below the EMA20 at 64.92, EMA50 at 73.70, and EMA200 at 87.98.
- RSI14 at 45 and MACD line below its signal confirm weak directional conviction on the daily timeframe.
- Hourly chart shows a tentative recovery with price above both short-term moving averages but still capped by the EMA200 at 66.64.
- Circle beat Q2 earnings estimates by 12.50% but missed revenue by 5.46%, driving elevated volatility.
- ATR14 at 4.79 signals substantial daily ranges; Arc mainnet launch is targeted for September 16.
Daily Trend Remains Bearish for Circle Stock Despite Earnings Reaction
Circle stock remains in a confirmed daily downtrend. It trades below all major moving averages despite the post-earnings bounce.
Moving Average Stack Confirms the Downtrend
The daily structure still reads bearish. Price at 63.28 sits below the EMA20 at 64.92. It also trades under the EMA50 at 73.70 and well below the EMA200 at 87.98. That stacked alignment above spot price is a textbook downtrend signature. Every rally into the mid-60s runs into layered resistance rather than open air.
Momentum and Volatility Signal Caution
RSI14 on the daily chart sits at 45. This is neither oversold nor bullish. It simply confirms the absence of strong directional conviction. MACD tells a more nuanced story. The line at -3.15 remains below the signal at -3.95, keeping the broader momentum reading negative. However, the histogram has turned positive at 0.80. This hints that downside momentum is losing force, even if the trend itself hasn’t flipped.
Bollinger Bands show price near the 63.72 midline. The upper band sits at 68.65 and the lower band at 58.79. Nothing extreme here—just a market consolidating inside its recent volatility envelope. Meanwhile, the ATR14 reading of 4.79 is substantial for a stock trading in the low 60s. That level of daily range makes sense given the news backdrop. It confirms whipsaw price action should be expected in either direction. For Circle stock, the daily pivot at 62.20 frames the immediate battleground. Resistance sits at 65.28 and support at 60.20.
Hourly Chart Shows Tentative Recovery in CRCL
CRCL shows a short-term recovery on the hourly chart. Price is now above both the EMA20 and EMA50, though the EMA200 still caps the move.
Turning to the 1H timeframe complicates the daily bearish read. Price at 63.36 now trades above the EMA20 at 62.66 and EMA50 at 62.67. However, it remains capped by the EMA200 at 66.64. The regime here is labeled neutral, not bearish. RSI14 at 54.62 leans mildly positive. MACD on this timeframe confirms the short-term tilt. The line at 0.38 sits above the signal at 0.21, with a positive histogram of 0.17. In short, hourly momentum points higher.
Notably, Bollinger Bands on the 1H show price near the upper half of the range. It sits between the 62.21 mid and 65.11 upper band. The hourly pivot at 63.55 with resistance at 64.01 and support at 62.90 shows price straddling the pivot. This signals indecision at this specific level. The daily chart still says CRCL remains in a downtrend dominated by longer moving averages. The hourly chart says a short-term bounce is underway. Neither view is wrong—they simply operate on different horizons. Therefore, any hourly strength is happening inside a larger bearish container.
15-Minute Chart: Intraday Strength Near Pivot
The 15-minute chart displays a fully bullish moving average stack. However, intraday momentum has stalled near the pivot, favoring patience over aggression.
Meanwhile, the 15m timeframe remains useful for timing, not for defining bias. Price at 63.36 trades above its EMA20 at 63.17, EMA50 at 62.72, and EMA200 at 62.89. That is a fully bullish stack on this micro timeframe. RSI14 at 52.84 is unremarkable, sitting around the midpoint. MACD is essentially flat. The line at 0.27 barely exceeds the signal at 0.24, with a histogram of just 0.02. That flatness suggests intraday momentum has stalled near the 15m pivot at 63.35. Resistance sits at 63.60 and support at 63.10. Execution conditions favor patience until this tight range resolves.
What’s Driving the Move: Circle’s Mixed Earnings Story
Circle’s mixed Q2 results—an earnings beat paired with a revenue miss—drove the recent volatility in the stock.
The news flow around Circle stock this week explains much of the turbulence. Circle Internet Group reported second-quarter results that beat earnings estimates by 12.50% but missed on revenue by 5.46%, according to Yahoo Finance. Shares initially jumped roughly 7% in pre-market trading. The surge followed news that the company secured the first federal bank charter granted to a stablecoin issuer. Circle also raised parts of its full-year outlook. Later in the session, however, another report noted the stock down 5% as investors digested the mixed results.
Beyond the immediate print, Circle laid out longer-term guidance. The company outlined $310 million to $330 million in projected 2026 other revenue, according to Seeking Alpha. It also confirmed that its Arc mainnet is targeting a September 16 launch. USDC circulation stood at $73.3 billion, alongside ties to DTCC and BlackRock. CEO Jeremy Allaire framed the strategy around building infrastructure for the “internet financial system.” This positioning casts Circle as more than a single-product stablecoin issuer. Whether the market fully credits that thesis will likely show first in how CRCL behaves around the daily EMA20 in the coming sessions.
Bullish Scenario for Circle Stock
For Circle stock to turn bullish, it must reclaim the daily EMA20 at 64.92 and break through R1 at 65.28 on volume.
Overall, a push through that level with conviction would start challenging the bearish daily regime directly. Supporting evidence would include the daily MACD histogram continuing to expand. RSI14 would also need to clear above 50 on a sustained basis. The hourly uptrend should extend toward the EMA200 at 66.64. The September 16 Arc mainnet launch and the raised revenue guidance could serve as fundamental catalysts. These would give any technical breakout more staying power.
Bearish Scenario for Circle Stock
The bearish case for Circle stock holds as long as price remains capped below the daily EMA20 and the 63.72–64.92 resistance zone.
On the other hand, a rejection at these levels would keep bears in control. A subsequent break below the daily pivot at 62.20 and then S1 support at 60.20 would confirm the broader downtrend is reasserting itself. The overhang from the EMA50 at 73.70 and EMA200 at 87.98 remains a significant structural ceiling. Until price closes that gap meaningfully, every bounce risks being treated as a selling opportunity by trend-following participants.
Closing Thoughts on CRCL
In summary, CRCL presents a classic timeframe conflict: daily bearish, hourly constructive, and intraday neutral. The elevated ATR14 confirms that whichever direction wins will likely come with real force. Given the mixed earnings reaction and layered technical resistance overhead, a cautious approach seems prudent. Waiting for confirmation beyond the daily EMA20 or a clean break of the 60.20 support makes more sense than chasing the current bounce.
FAQ
Is Circle stock currently in a downtrend?
The daily chart for Circle stock remains bearish. Price trades below the EMA20 at 64.92, EMA50 at 73.70, and EMA200 at 87.98. However, the hourly chart shows a short-term recovery underway, with price above the EMA20 and EMA50 on that timeframe.
What key levels should traders watch for CRCL?
The most important levels are the daily EMA20 at 64.92 as near-term resistance, the daily pivot at 62.20 as a central battleground, and S1 support at 60.20 as the bearish trigger. On the upside, R1 at 65.28 and the hourly EMA200 at 66.64 represent additional hurdles for bulls.
What caused the recent volatility in Circle stock?
Circle’s Q2 earnings report drove the volatility. The company beat earnings estimates by 12.50% but missed revenue by 5.46%. Shares initially jumped 7% in pre-market on news of the first federal bank charter for a stablecoin company and raised guidance, before falling 5% as investors digested the mixed results.
When is Circle’s Arc mainnet expected to launch?
Circle confirmed that its Arc mainnet is targeting a September 16 launch. The company also outlined $310 million to $330 million in projected 2026 other revenue, positioning the launch as part of a broader infrastructure strategy tied to the “internet financial system.”
Disclaimer: This article is for informational purposes only and does not constitute financial advice, an investment recommendation, or a solicitation to buy or sell any financial instrument or cryptocurrency. The analysis provided is not indicative of future results. Investing in crypto assets and financial markets carries a high risk of capital loss. Always do your own research (DYOR) and consult a qualified financial advisor before making any decision.
Article produced with the assistance of artificial intelligence and reviewed by the editorial team.