
The Chainlink price prediction just picked up its most convincing signal in months, with $LINK clearing the 200-day EMA at $9.533 today for the first time since May, backed by rising volume rather than a quick, thin spike that fades by the next session.
$LINK Price Analysis: Above the 200-Day EMA With OBV Confirming the Move
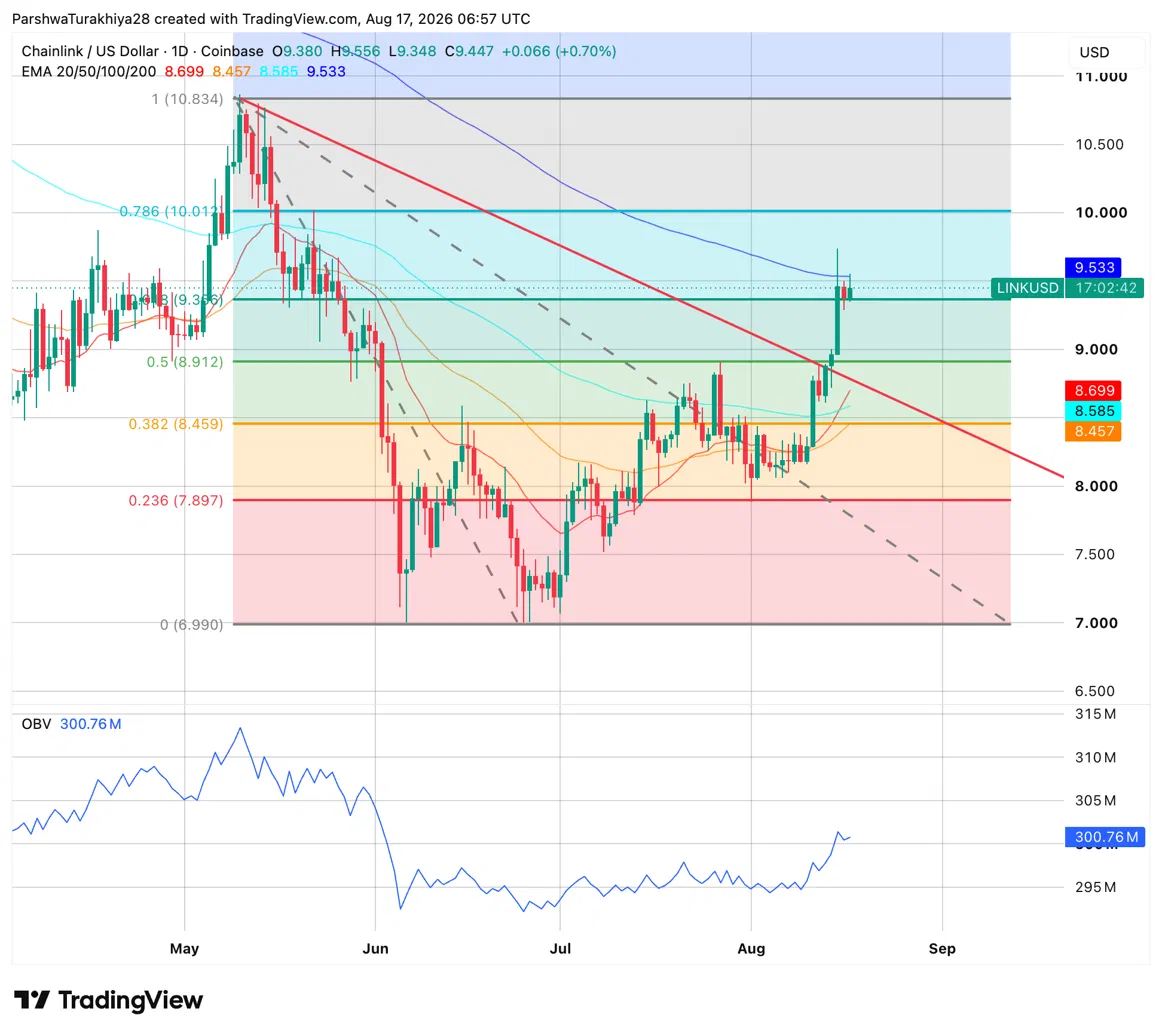
The daily chart shows $LINK breaking above the 200-day EMA at $9.533, a level it has not closed above since May. Today’s session opened at $9.38, pushed to $9.556, and is holding at $9.447, sitting just below the 200-day as buyers defend the breakout. The On-Balance Volume indicator at 300.76M has been rising steadily since the August lows, confirming that the recent price move is being backed by genuine buying volume rather than thin air.
Related: Portal Price Prediction: PORTAL Holds Bullish Structure as Profit-Taking Risk Rises
The 20-day EMA at $8.699, 50-day at $8.457, and 100-day at $8.585 all sit comfortably below current price, confirming the EMA stack is now fully bullish for the first time since April. Above current price, the 0.618 Fibonacci at $9.336 has been cleared and the 200-day at $9.533 is the level that needs to hold on a daily close. The 0.786 Fibonacci at $10.012 and the $10 round number are the next targets if the 200-day confirms as support.
$LINK Support and Resistance Levels, August 17, 2026
$LINK Analysis: Bullish Pennant Building on the 15-Minute Chart
#$LINK/USDT 👀
— Crypto With Gopal (@cryptowithgopal) August 17, 2026
Bullish Pennant forming after a strong upward move! 🚀📈 Price is consolidating around $9.45 while the trendlines tighten, showing buyers are holding the higher structure.
A confirmed breakout above $9.60–$9.70 could signal the next momentum leg higher. Bulls need… pic.twitter.com/mLI297TrBj
Analyst Crypto With Gopal flagged a bullish pennant forming on the 15-minute chart after $LINK’s sharp upward move from $8.70 to $9.75 between August 14 and 15. Price has since been consolidating around $9.45 as both trendlines tighten, with buyers defending higher lows and sellers unable to push price back below $9.30.
A confirmed breakout above the $9.60 to $9.70 zone would signal the next momentum leg higher. The key support to hold in the meantime is $9.30 to $9.35. Gopal’s sentiment read is bullish, describing it as a breakout setup building rather than one that has fully triggered.
$LINK News: Whale Moves $2.74M to Self-Custody
INVESTOR MOVES ~290K $LINK TO SELF-CUSTODY
— Onchain Lens (@OnchainLens) August 17, 2026
A wallet moved 289.76K $LINK (~$2.74M) to its Gnosis Safe Multisig wallet two hours ago.
The tokens were accumulated from Binance over the past month.
Address: 0x988c5B821629A56ac6D28256Bf19DCd48FFf1cfc pic.twitter.com/l1lhJuOoVN
Onchain Lens flagged that a wallet moved 289,760 $LINK worth approximately $2.74M to a Gnosis Safe multisig self-custody wallet on August 17. The tokens were accumulated from Binance over the past month.
Moving assets to a Gnosis Safe multisig is typically associated with long-term holding conviction rather than preparation to sell, as the added security layer of a multisig wallet is designed for assets intended to stay put. The move aligns with the broader OBV signal on the daily chart, where buying volume has been quietly building through August.
$LINK ETF Flows: Highest Inflow Day Since July 22
$LINK spot ETFs recorded $1.47M in daily net inflows on August 14, the highest single day since July 22, entirely from Bitwise’s CLNK product according to SoSoValue. Grayscale’s GLNK recorded zero flow on the day. Cumulative net inflows across both products now stand at $129.36M with total net assets at $120.98M.
The timing of the inflow is notable. August 13 had posted a $390.58K outflow, the only negative day in recent weeks, and August 14’s $1.47M more than reversed it. The daily inflow chart shows $LINK ETF assets rising consistently through August even on days with zero flow, reflecting the price appreciation rather than new capital alone.
$LINK Derivatives: Shorts Absorbing Most of the Pain
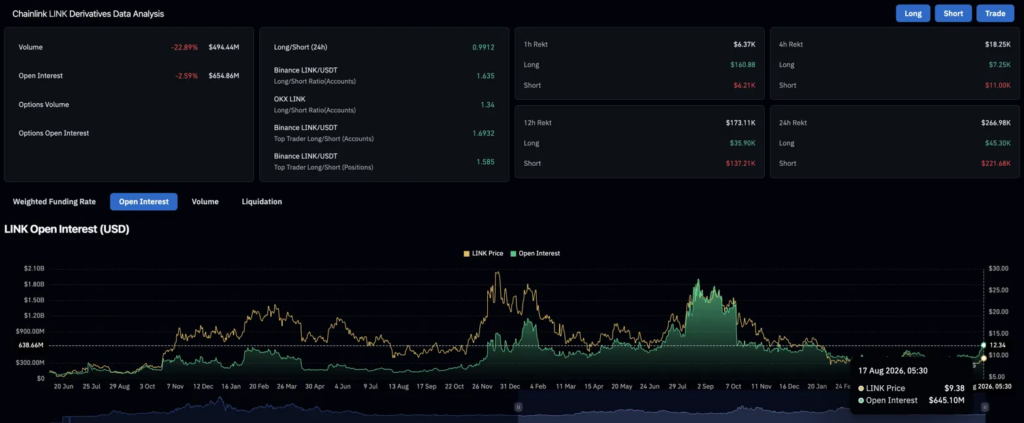
Trading activity quieted down on August 17 with volume falling 22.89% to $494.44M and open interest dropping 2.59% to $654.86M. Fewer new positions are being opened, which is normal after a sharp price move as traders wait for the next signal. Despite the quieter session, positioning across exchanges leans clearly long. Binance retail sits at 1.635, OKX at 1.34, and top trader accounts at 1.6932, with larger accounts holding proportionally bigger long positions at 1.585.
Related: Cardano Price Prediction: ADA Stopped Bleeding After Nine Days as Cardano’s Biggest Upgrade Hit 96% Readiness
Liquidations tell the most interesting story. Of the $266.98K liquidated over 24 hours, shorts absorbed $221.68K while longs lost just $45.30K. Traders who were betting against $LINK’s move higher are the ones taking the pain, which is consistent with a genuine price breakout rather than a fakeout.
$LINK Price Prediction: Upside and Downside Targets
Bullish Case, Target: $10 (Round Number)
$LINK holds the 200-day EMA at $9.533 on a daily close, confirming it as support rather than resistance. The bullish pennant on the 15-minute chart breaks above $9.60 to $9.70, triggering the next momentum leg. Whale self-custody moves and rising OBV signal continued conviction, and FOMC minutes on August 19 come in less hawkish than feared, supporting risk assets broadly. Price extends toward the 0.786 Fibonacci at $10.012 and the $10 round number.
Bearish Case, Risk Level: $8.912 (0.5 Fibonacci)
The 200-day EMA at $9.533 fails to hold on a daily close and the bullish pennant resolves lower, losing the $9.30 to $9.35 support Gopal flagged. FOMC minutes reveal a more hawkish tone than expected and $LINK ETF inflows stall, removing the institutional demand layer. Price retreats toward the 0.5 Fibonacci at $8.912 and the 20-day EMA at $8.699 as the next support cluster.
Conclusion
$LINK’s breakout is unusually well supported for a single-session move: rising OBV confirms real volume behind the price, a whale just chose to lock up $2.74 million in self-custody instead of selling, and ETF inflows just posted their best day in nearly a month.
All three point the same direction without contradicting each other, which is rarer than it sounds. The 200-day EMA at $9.533 is the level that decides what happens next, hold it through Wednesday’s FOMC minutes and $10 becomes a realistic target, lose it and the bullish case built over the past few sessions needs to prove itself again from $8.912.
FAQs
What is the Chainlink price prediction right now?$LINK trades at $9.447 after clearing the 200-day EMA at $9.533. The bullish target is $10; the bearish risk level is $8.912 if the 200-day fails to hold as support.
Why did $LINK break above its 200-day EMA?Rising On-Balance Volume confirms genuine buying behind the move, and $LINK’s full EMA stack turned bullish for the first time since April, with price clearing the 0.618 Fibonacci at $9.336 along the way.
Are $LINK ETF inflows picking back up?Yes. $LINK ETFs logged $1.47M in inflows on August 14, the strongest single day since July 22, reversing the prior day’s $390.58K outflow entirely.
What level does $LINK need to hold to stay bullish?The 200-day EMA at $9.533 on a daily close, with the bullish pennant’s $9.30 to $9.35 support as the secondary level to watch in the near term.
Is $LINK a good buy right now?$LINK has multiple bullish signals converging right now, a 200-day EMA breakout, whale accumulation, and rising ETF inflows, but FOMC minutes on August 19 add real near-term uncertainty. This is not financial advice, so weigh the bullish and bearish cases above against your own research.