
- Chainlink ($LINK) is currently hovering at $8.
- The sellers might pull the price even lower.
Chainlink ($LINK) has been under pressure for the last month, as the bears are dominant on the chart, which also decides its direction. Also, there are signs of brief recovery attempts, to invite bulls, to escape the downside trading pattern. The four-hour trading pattern looks negative, since it continues to float within a well-established downtrend.
Moreover, the bearish price alignment confirms that the potential sellers are present in the broader market trend of Chainlink. Notably, the momentum indicators remain firmly depressed until an aggressive buying volume floods into the $LINK market, absorbing the persistent supply and forcing a decisive shift toward green, bullish territory.
At press time, Chainlink is trading within the $8.18 range, losing a modest 2.78% over the last 24 hours. The price is holding above the daily low, settled at around $8.13. The day’s highest trading level is at $8.48. The asset’s daily trading volume has dropped by 6%, reaching the $261.72 million zone.
Key Support and Resistance Levels of Chainlink
While looking at the short-term price structure, the bearish momentum in the $LINK market could find the nearest support at $8.02. Upon the downside correction intensifies, a deeper zone might emerge below, which decides whether it should stall or fall.
On the other hand, if the Chainlink momentum flips bullish, the first recovery level would be at $8.33. A stronger move above this range confirms that the buyers might gain control. Gradually, the bulls could reach the higher targets that are aimed to be broken.
What is $LINK’s Technical Momentum Conveying?
The Moving Average Convergence Divergence line crossing below the signal line shows that the short-term buying momentum is slowing down. It allows sellers to pull the price lower. Both lines are positioned above the zero midline.
This is typical pullback behaviour, not a structural trend reversal. $LINK traders often view this setup as an opportunity to watch for a stabilisation phase once the MACD curves back up toward the signal line.
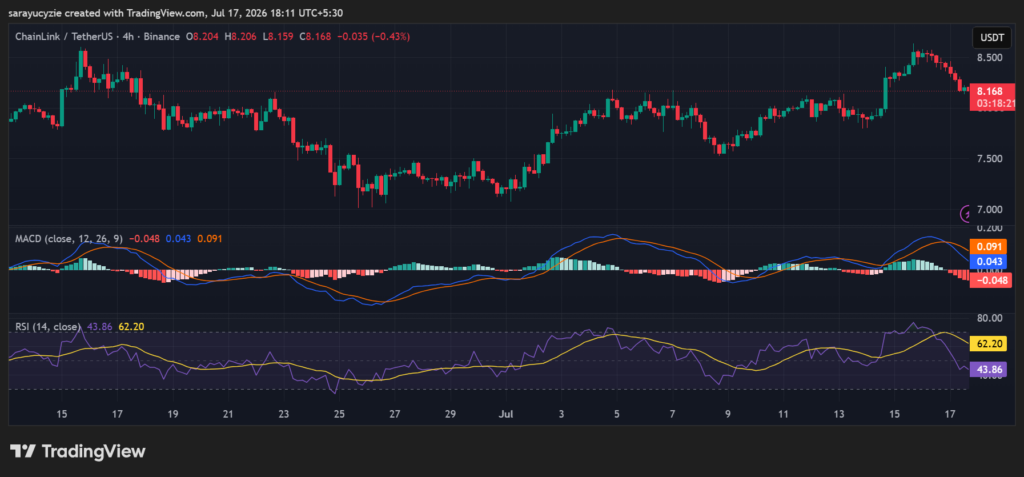
Furthermore, the daily Relative Strength Index (RSI) is resting at 43.86, reflecting a neutral market condition leaning slightly bearish. As the value sits between the overbought boundary and the oversold floor, Chainlink is not overextended in either direction.
The sellers currently have a modest edge, but they do not possess aggressive control. This is a consolidation zone, and traders look for a decisive break above 50 or below 40 to confirm the next short-term trend.