
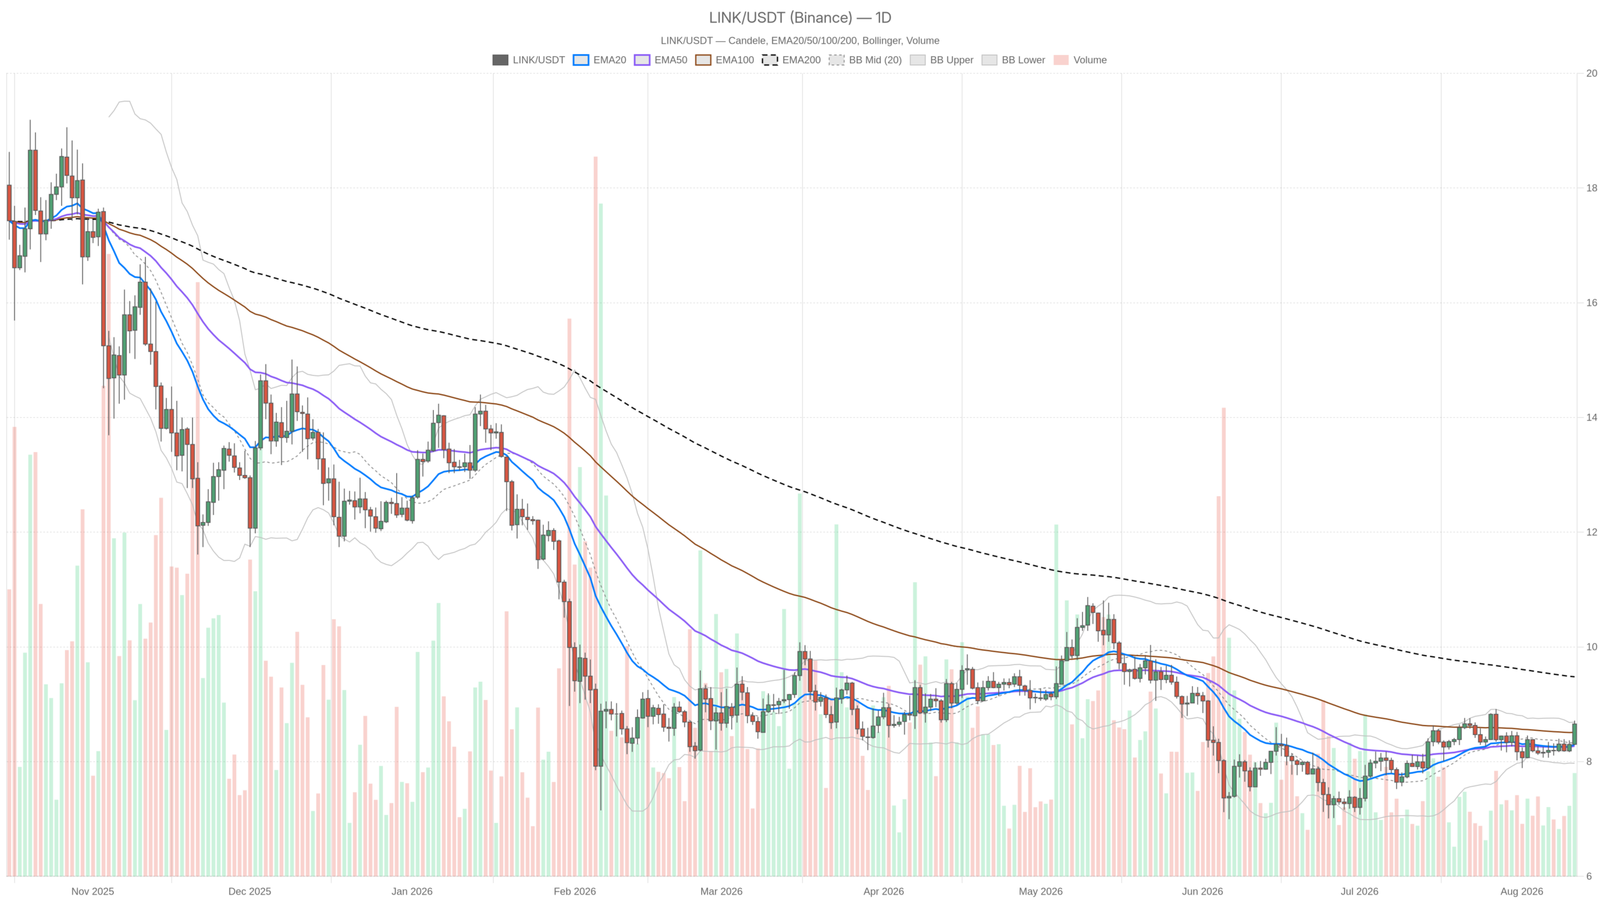
As of August 11, 2026, a striking divergence is unfolding: Chainlink crypto is pressing higher while the broader market contracts. LINKUSDT trades at 8.66, pinned against the upper daily Bollinger Band at 8.69, with total crypto market capitalization at roughly $2.277 trillion after a 0.99% daily decline.
Key takeaways
- $LINK trades at 8.66, pinned against the upper daily Bollinger Band at 8.69
- Daily RSI at 59.79 reflects accumulation without being overbought
- The 200-day EMA at 9.48 remains the critical resistance level to reclaim
- Fear & Greed Index at 29 and Bitcoin dominance at 56.54% describe a defensive macro environment
- Hourly RSI at 77.61 signals the short-term move is extended; risk-to-reward favors patience
Daily Timeframe: Neutral on Paper, Constructive Under the Hood
The daily chart reads neutral, but beneath the surface it shows genuine accumulation rather than a blow-off. Price at 8.66 sits above the 20-day EMA at 8.30 and the 50-day EMA at 8.27, both glued together — a signature of a market that has spent weeks going nowhere and is only now trying to pick a direction.
Those two averages are flat rather than sloping upward, which matters: this is a breakout attempt out of compression, not the continuation of an established trend. The 200-day EMA at 9.48 looms roughly 9% above spot. Until that level is reclaimed, every rally remains structurally a bounce inside a broader downtrend, regardless of how convincing the lower timeframes appear.
Daily RSI at 59.79 is the most useful number on the chart. It is firm without being overheated — the kind of reading that shows real accumulation rather than a blow-off. There is room to run before the daily gets stretched, which is precisely why the lower-timeframe froth does not automatically kill the setup.
MACD backs that up, if modestly: the line at 0.04 sits above the 0.03 signal with a 0.01 histogram. Momentum has turned, but it has not accelerated. This is an engine that just started, not one running hot.
Bollinger Bands frame the tension neatly. The mid-band sits at 8.33, the upper at 8.69, and the lower at 7.97. Price is riding the ceiling. Closing decisively above the upper band would signal genuine expansion. Failing there and rotating back to 8.33 would confirm this was merely a mean-reversion trip to the top of the range.
Moreover, ATR at 0.29 on the daily means a normal session can cover the entire distance from 8.66 to the mid-band and beyond. Consequently, a single red candle should not be read as a trend change. Daily pivots place the pivot point at 8.55, with R1 at 8.82 and S1 at 8.39. Price trading above its pivot is a small but real bullish tell.
R1 at 8.82 therefore becomes the first serious test of whether buyers are willing to pay up.
1H: Confirmation, With a Warning Attached
The hourly chart confirms bullish momentum, yet it also carries clear overbought risk that demands respect. EMAs are perfectly stacked: 20 at 8.42, 50 at 8.35, and 200 at 8.28, all below a close of 8.65. Structurally, that is as clean as it gets.
MACD at 0.08 over a 0.05 signal with a 0.03 histogram shows expanding, not fading, momentum. However, RSI sits at 77.61, deep in overbought territory. That is not a sell signal in a trending market, as strong impulses routinely park RSI above 70 for hours. Still, it does mean the easy money has already been made.
Price is also trading above the upper hourly Bollinger Band at 8.63, with the mid-band way back at 8.38. That is the definition of an extended move. Hourly ATR is a mere 0.07, so realized volatility is compressed relative to the daily. When that gap closes, it usually closes abruptly.
Essentially, hourly pivots are stacked almost on top of each other — pivot 8.66, R1 8.68, S1 8.63 — a five-cent cage. That is not a range; that is a coiled spring. Whichever side breaks first will trigger an outsized reaction from stops.
15m: Execution Context Only
The 15-minute chart mirrors the hourly: EMAs stacked at 8.55, 8.46, and 8.34 beneath an 8.65 close. RSI sits at 76.45, and MACD remains positive at 0.07 versus a 0.06 signal. Note, however, that the histogram is thinning to 0.02. The micro-impulse is losing a little steam even as structure holds.
With ATR at 0.05 and the upper band at 8.72, the realistic short-term ceiling before a pause sits just above current price. For traders timing entries, the 8.52 mid-band is the first logical pullback shelf. Below that, 8.32 is where the 15m structure would genuinely break.
Where the Timeframes Disagree — and Why That Matters
The daily and intraday charts are not telling the same story, and that disagreement typically resolves in one of two specific ways. The daily says neutral, below the 200 EMA, with barely positive momentum. The 1H and 15m, in contrast, say bullish, extended, and overbought.
Historically, this combination resolves either with the daily catching up — making the 200 EMA a magnet — or with intraday froth mean-reverting and the daily settling back toward 8.33. The macro backdrop does not help the bulls’ case. A Fear reading of 29, a shrinking total market cap, and BTC dominance above 56% describe defensive positioning where capital hides in Bitcoin rather than rotating into large-cap altcoins.
On the other hand, DefiLlama fee data shows on-chain activity is anything but dead. Uniswap V4 fees surged 209.13% in a day and 49.12% on the week. Fluid DEX rose 147.96% daily and 100.45% weekly, while Curve DEX collapsed 84.88% over seven days.
That is not a dying market — it is a violent rotation of liquidity between venues. And violent rotation is exactly the environment where individual names like $LINK can rally against the tape. Meanwhile, the day’s dominant headline is political rather than crypto-specific: Trump signing an executive order on childhood vaccines, per CNBC. It is macro noise that shapes risk appetite without giving digital assets a directional narrative.
The Two Scenarios
Bullish path: $LINK holds above 8.55 and pushes through the upper daily band at 8.69. That opens R1 at 8.82 as the first target. From there, the conversation shifts to whether the 200-day EMA at 9.48 comes into play. The tell would be hourly RSI cooling from 77.61 toward the 60s without price giving up the 8.42 area.
Momentum resetting while structure holds is how sustainable trends are built. What kills this thesis: a daily close back below 8.33, the Bollinger mid-band. At that point the breakout attempt has failed and the neutral daily regime reasserts itself.
Bearish path: The overbought intraday readings unwind in an ugly way. Losing the 8.63 hourly support cluster triggers a slide toward the 8.42 EMA and then 8.38. S1 at 8.39 on the daily is the line that separates a healthy pullback from a failed move. Below that, the 8.30–8.27 EMA pair is the last real defense before 7.97.
With daily ATR at 0.29, that entire cascade fits inside a couple of sessions. What invalidates the bearish case: a reclaim and hold above 8.66 with the MACD histogram expanding rather than shrinking on the hourly.
Positioning Around an Unresolved Chart
The honest read is that this is a momentum trade inside a market that has not earned trust yet. Anyone chasing here is buying at the upper band on three timeframes simultaneously with RSI in the mid-70s intraday. Mathematically, it is the worst risk-to-reward point in the move, even if the direction eventually proves right.
The more patient framing waits for the hourly to breathe: a pullback into 8.52–8.42 that holds would offer the same directional exposure at a fraction of the drawdown risk. Two factors deserve respect. First, the volatility mismatch: hourly ATR of 0.07 against daily ATR of 0.29 means the market is pricing far less movement than it has recently delivered.
Compression that extreme rarely lasts. Second, the sentiment backdrop — Fear at 29 with market cap contracting — means a single risk-off impulse in Bitcoin can override everything constructive on the $LINK chart in minutes. Chainlink crypto is showing genuine relative strength, but relative strength in a defensive market is a fragile asset, not a durable one.
Until 9.48 is reclaimed, the burden of proof stays with the buyers.
FAQ
Is $LINK a buy at current levels?
$LINK is trading at the upper Bollinger Band on three timeframes with hourly RSI at 77.61. This represents the mathematically worst risk-to-reward point in the current move. A more patient approach would wait for a pullback into the 8.52–8.42 zone before considering entry.
What is the key resistance level for $LINK?
The 200-day EMA at 9.48 is the critical resistance. Until it is reclaimed, every rally remains structurally a bounce inside a broader downtrend. The nearer-term test is R1 at 8.82, which becomes the first serious gauge of whether buyers are willing to step in.
Why is $LINK rising while the broader market is in fear?
On-chain data from DefiLlama shows violent liquidity rotation between DeFi venues rather than a dying market. In such environments, individual tokens like $LINK can rally against the tape. However, the Fear & Greed reading of 29 and Bitcoin dominance above 56% mean this relative strength remains fragile.
Disclaimer: This article is for informational purposes only and does not constitute financial advice, an investment recommendation, or a solicitation to buy or sell any financial instrument or cryptocurrency. The analysis provided is not indicative of future results. Investing in crypto assets and financial markets carries a high risk of capital loss. Always do your own research (DYOR) and consult a qualified financial advisor before making any decision.
Article produced with the assistance of artificial intelligence and reviewed by the editorial team.