As of July 6, 2026, the Cardano price today reflects a market stuck in compression. $ADA is trading at $0.18, caught between a constructive daily chart and an intraday structure that is quietly rolling over. The broader crypto market offers little relief, with total market cap at roughly $2.27 trillion and the Fear & Greed Index at 24 — Extreme Fear.
Key takeaways
- $ADA trades at $0.18 on July 6, 2026, caught between a constructive daily structure and bearish intraday momentum.
- Daily RSI at 58.56 suggests room to push higher, but $0.19 remains the critical inflection level where multiple resistance zones converge.
- Fear & Greed Index at 24 and $BTC dominance near 55.7% signal a risk-off macro environment suppressing altcoin appetite.
- A Bollinger Band squeeze across all timeframes indicates a volatile breakout is imminent — direction remains undecided.
- A daily close above $0.19 invalidates the bearish case; a break below $0.17 would confirm sellers are in control.
The Daily Picture: A Fragile Recovery Stalling Out
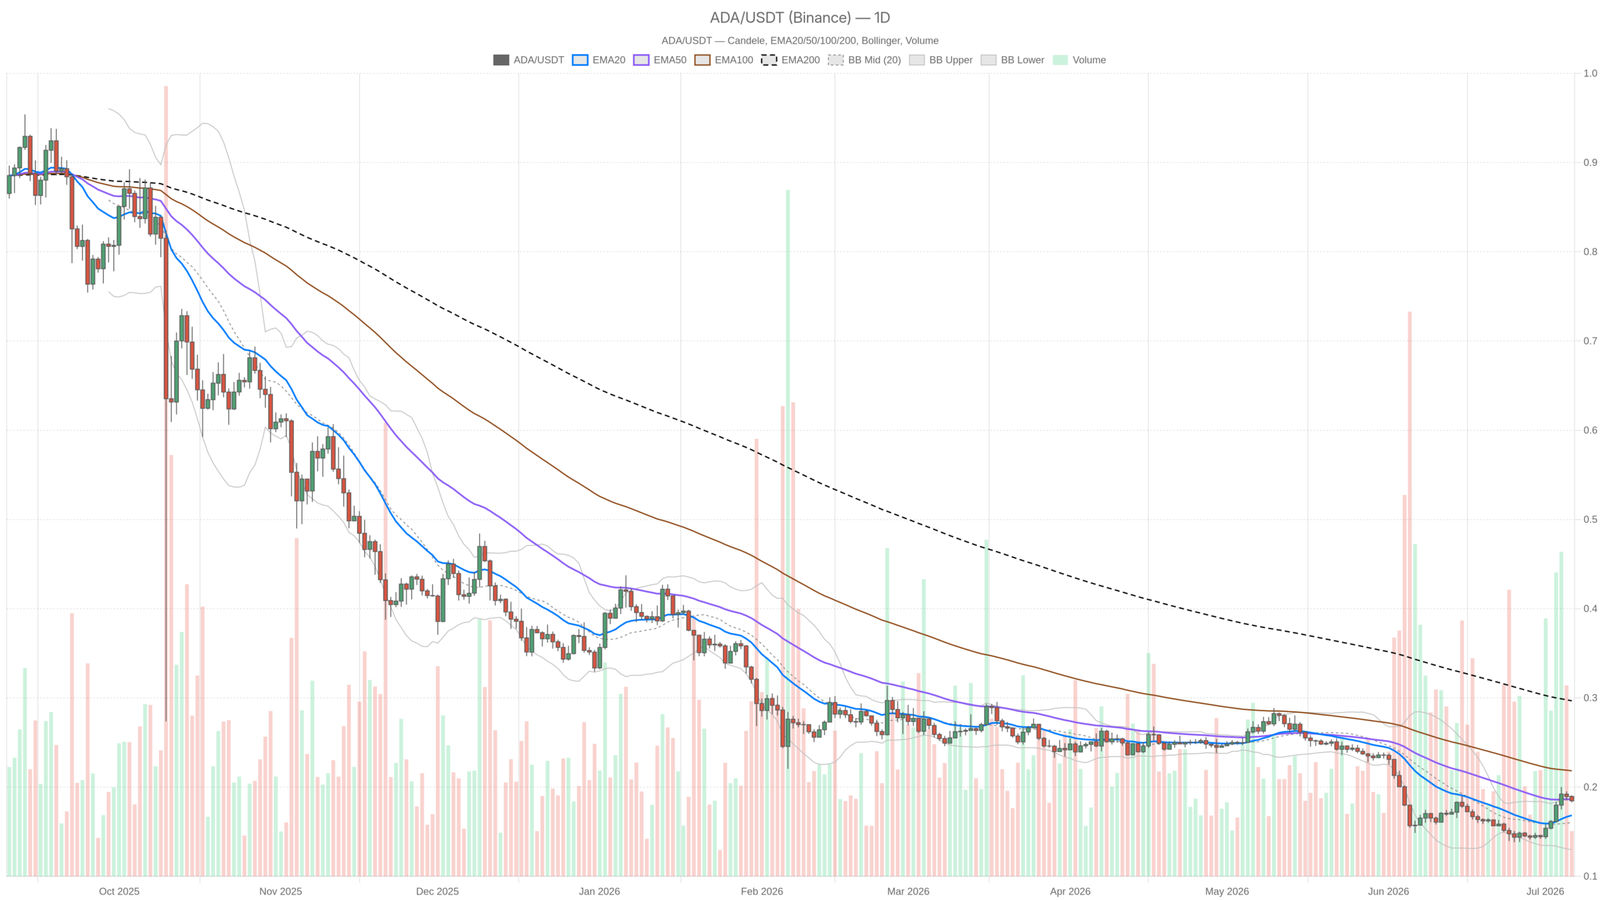
On the daily timeframe, the macro bias is technically neutral but leaning cautious. Price closed at $0.18 — sitting above the EMA20 at $0.17, which is encouraging in isolation, but still firmly below the EMA50 at $0.19 and well beneath the EMA200 at $0.30. That EMA200 gap is a constant reminder of how far $ADA has fallen from its broader structural highs.
However, the price is recovering from a deeper low in the shadow of significant overhead resistance. The daily RSI at 58.56 deserves attention — it is the most constructive reading across all timeframes, above the neutral 50 line and not yet overbought. That tells you there is still room to push higher without hitting a ceiling from momentum exhaustion alone.
Meanwhile, the MACD is barely alive: line at 0, signal at -0.01, histogram at +0.01. A positive histogram crossover just occurred, but it is razor-thin. This is a momentum signal that has not committed yet, not confirmation of a trend. Moreover, Bollinger Bands on the daily frame show mid at $0.16, upper at $0.19, lower at $0.13. Price is pressing against the upper band at $0.19, which coincides with the EMA50 and the pivot point. That convergence makes $0.19 the critical inflection level. The ATR sits at $0.01, meaning daily ranges are extremely compressed — a coiled spring, but the direction of the uncoil remains undecided.
Intraday Reality Check: 1H and 15M Are Not Playing Along
Drop down to the 1-hour chart and the mood shifts. RSI has slipped to 38.85 — not panic-level oversold, but below 40, meaning short-term momentum has quietly flipped to the sellers. The EMA20 and EMA50 on the 1H are both sitting at $0.19, above current price. That is a bearish alignment: price trades below both short-term moving averages, while the 1H EMA200 at $0.17 acts as the only soft floor beneath.
The Bollinger Bands on the 1H have collapsed to near-zero width — upper at $0.19, lower at $0.18, mid at $0.19. This kind of squeeze usually precedes a directional move, though it gives no clue about which way. MACD on the 1H is flat at zero across line, signal, and histogram. Dead. No edge from momentum on this timeframe whatsoever.
Furthermore, the 15-minute chart mirrors the 1H almost exactly: RSI at 39.63, all EMAs stacked at $0.19 above price, Bollinger Bands in an identical squeeze. Pivot levels across both short timeframes are pinned at $0.18 — the market is essentially standing still, waiting for a catalyst. For anyone seeking execution context, there is nothing clean here. Entries without a clear trigger are just noise.
On-Chain Pulse: Cardano’s DeFi Activity Sends Mixed Signals
According to DefiLlama data, Cardano’s native DEX ecosystem tells a somewhat contradictory story. Minswap — the dominant venue on the network — saw a 63% drop in fees over the past 24 hours, while SundaeSwap V2 collapsed by 96% day-over-day. On the surface, that looks alarming. Zoom out to the 7-day window, however, and several of these same protocols posted triple-digit fee growth: SundaeSwap +266%, Dano Finance a staggering +1,300%.
Yet the 30-day figures are uniformly brutal across the board, down 88–96%. What this suggests is a network seeing episodic bursts of activity without the sustained organic throughput that would underpin a durable price recovery. It is spiky volume, not sticky volume.
The Bullish Case: $0.19 Is the Gate
If $ADA is going to make a meaningful move higher, it must close a daily candle above $0.19 convincingly. That single level is where the EMA50, upper Bollinger Band, and pivot resistance all converge on the daily chart. A clean break and hold above that zone — ideally with the 1H RSI recovering back above 50 — would shift intraday structure and build the case for a run toward $0.21–$0.22.
The daily RSI still has headroom, and the MACD histogram has just flipped positive. If broader sentiment stabilizes and $BTC dominance begins to fade, this setup could develop quickly. That said, the scenario is invalidated if price fails at $0.19 multiple times and begins compressing lower. A daily close back below $0.17 — under the EMA20 — would suggest the bounce from lows has run its course.
The Bearish Case: Compression Breaks Down
The bear case does not require a dramatic catalyst — the environment is already doing the heavy lifting. With Fear & Greed at 24, $BTC dominance near 56%, and short-term momentum rolling negative on both the 1H and 15M, the path of least resistance could just as easily be lower.
If $0.18 cracks on a 1H close basis, the next real support is $0.17 at the daily EMA20. Below that, the lower Bollinger Band on the daily at $0.13 becomes a theoretical target — though that would require a significant deterioration in conditions. The bearish scenario is invalidated by a strong daily close above $0.19, particularly if accompanied by a pickup in on-chain activity and a broader risk-on rotation.
Where Does This Leave Traders?
Cardano right now is a coin with a usable daily setup that is being undermined by hostile short-term conditions. The daily timeframe has not broken down, but it has not broken out either — and the intraday charts are nudging toward the sellers. For traders tracking the Cardano price today, the $0.18–$0.19 range has become a decision zone that the market will be forced to resolve.
Volatility is abnormally low — the ATR on both the 1H and 15M is effectively zero, and Bollinger Bands are in a squeeze across all timeframes. When compression like this resolves, it tends to do so fast and with conviction. The window to position ahead of the move is shrinking, but the risk of being caught on the wrong side of a false breakout is elevated.
Size accordingly. The macro environment — extreme fear, high $BTC dominance, tepid total market cap movement — argues for caution over aggression until a cleaner signal emerges.
This analysis is based on market data sourced from Binance and on-chain metrics from DefiLlama. It is intended for informational and analytical purposes only.
FAQ
What is Cardano’s price today?
As of July 6, 2026, Cardano ($ADA) is trading at $0.18, caught in a tight compression range between $0.17 support and $0.19 resistance. The daily structure remains technically neutral while intraday momentum leans bearish.
Why is $ADA struggling to break above $0.19?
The $0.19 level represents a confluence of resistance: the daily EMA50, upper Bollinger Band, and pivot point all converge there. Additionally, the macro environment — with Fear & Greed at 24 and $BTC dominance near 56% — is suppressing risk appetite for altcoins like $ADA.
What needs to happen for Cardano to turn bullish?
$ADA needs a convincing daily close above $0.19, ideally accompanied by the 1H RSI recovering above 50 and a broader improvement in market sentiment. This would open the path toward the $0.21–$0.22 zone, with the daily RSI still offering headroom for further upside.
What is the bearish scenario for Cardano?
If $0.18 fails on a 1H close basis, the next support sits at $0.17 at the daily EMA20. A break below that could target the lower daily Bollinger Band at $0.13, though reaching that level would require a significant deterioration in broader market conditions.
Disclaimer: This article is for informational purposes only and does not constitute financial advice, an investment recommendation, or a solicitation to buy or sell any financial instrument or cryptocurrency. The analysis provided is not indicative of future results. Investing in crypto assets and financial markets carries a high risk of capital loss. Always do your own research (DYOR) and consult a qualified financial advisor before making any decision.
Article produced with the assistance of artificial intelligence and reviewed by the editorial team.