
MemeCore’s native token M has extended its decline over the past 24 hours, losing roughly 11% even as the memecoin-focused blockchain retained a 111% gain over the past seven days.
On the surface, that pullback erases only about a tenth of M’s accumulated gains and reads as a routine corrective phase.
The underlying data tells a different story, with sellers gaining ground across the market in a way that could drag the asset lower from current levels.
Is selling pressure getting stronger?
Capital is contracting across MemeCore’s markets, with the gap between spot and perpetual traders narrowing as fresh flows move into the derivatives side.
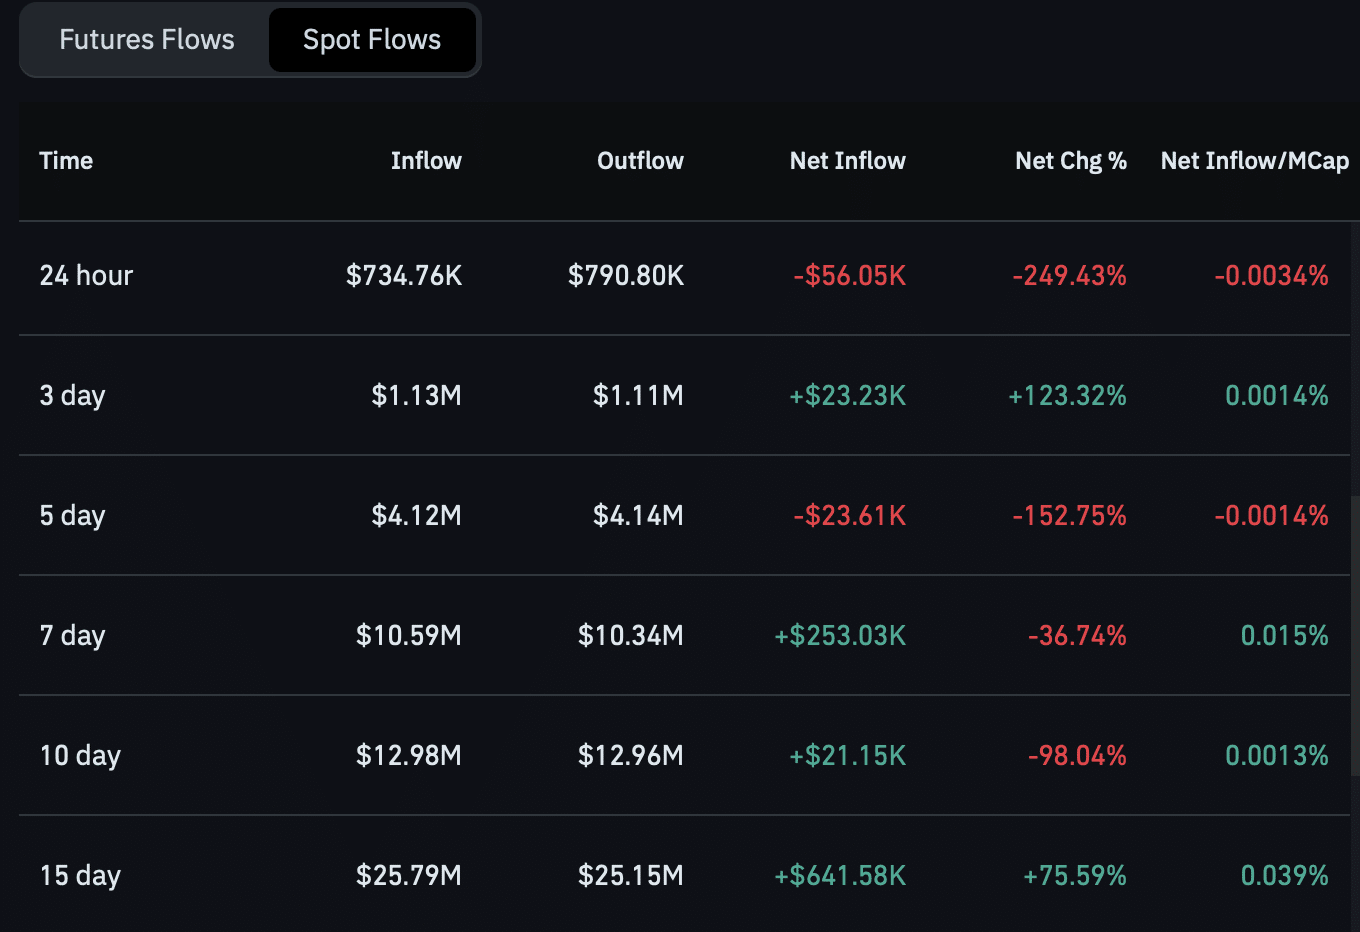
Spot Netflow data showed buyers absorbed roughly $790,000 worth of M, while sellers offloaded about $743,000, leaving a slim net inflow of around $56,000.
That balance tilts toward buyers, yet the edge is too thin to spark a decisive rally, and the imbalance sharpens in the perpetual market, where rising inflows are colliding with heavy selling volume.
MemeCore’s perpetual contracts drew a netflow of roughly $668,200, pointing to more capital channeled into leveraged positions on M. That inflow skews toward sellers, though, the Taker Buy Sell Ratio has slid to 0.823 in the latest CoinGlass reading, meaning market sells are outpacing market buys.
Mounting sell pressure in the perpetual market, set against shrinking spot capital, leaves M in a tight spot as it tries to rebuild momentum for a near-term move higher.
MemeCore [M] tests a major level
MemeCore traded inside a symmetrical triangle pattern.
The formation typically develops after a sharp price advance as the price consolidates between converging support and resistance lines. The pattern often precedes a breakout.
M now needed to clear horizontal resistance at $1.28.
A break above that level would still leave the price facing the pattern’s descending resistance. Clearing both barriers could confirm a stronger bullish move, while another rejection would likely extend consolidation.
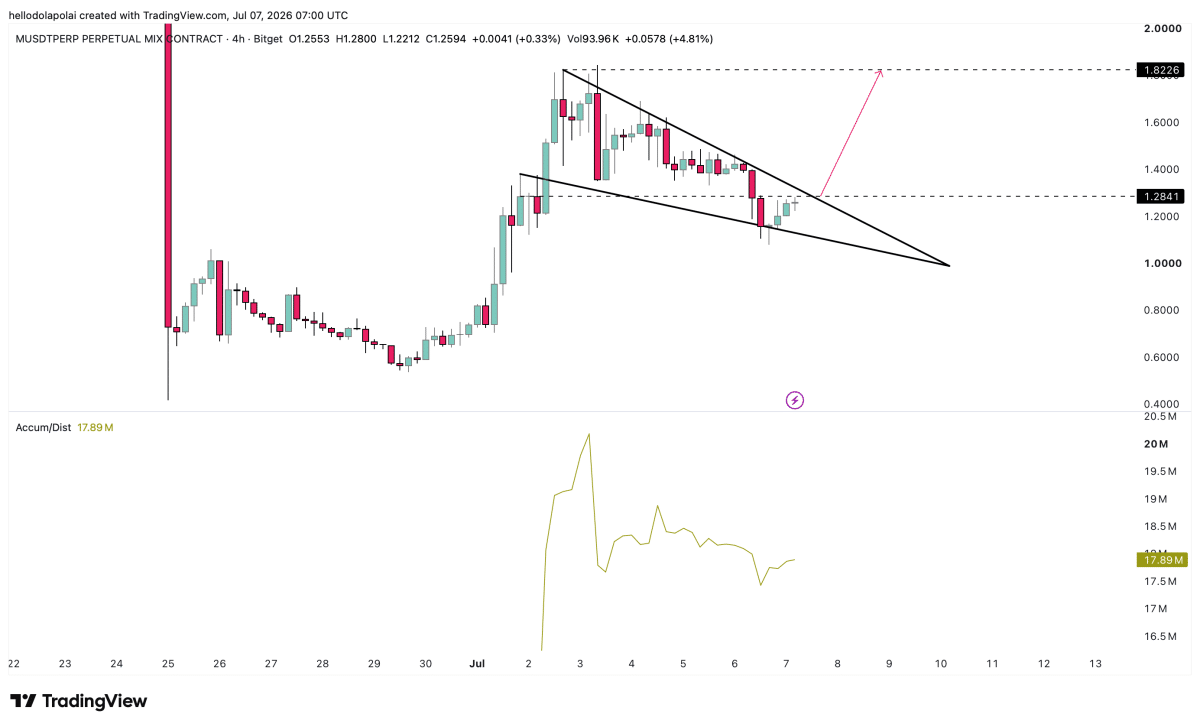
Reinforcing the setup, the Accumulation/Distribution (A/D) indicator is climbing, a sign that buying has outweighed selling across the broader market.
A sustained rise in the indicator would show accumulation building beneath the price, a dynamic that tends to support M over time.
Whales accumulate as retail steps back
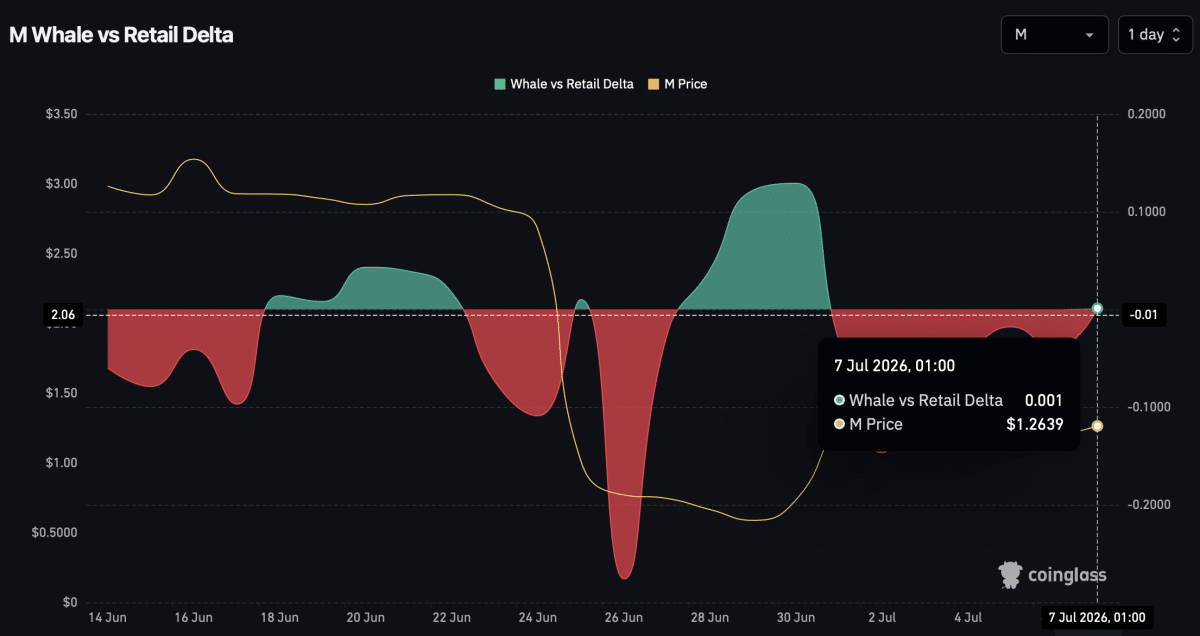
The Whale-to-Retail Delta recently flipped positive, though only marginally, at 0.01, a slim edge for large holders over retail participants.
That shift points to whales stepping in while retail investors are exiting.
Whales hold deep capital that frequently steers market direction, and their positioning could prove decisive in whether M resumes its slide or turns higher.
Even so, Spot buying continued outweighing selling, while most bearish pressure originated from the perpetual market. The A/D indicator also continued pointing toward accumulation.
If whale accumulation continues supporting Spot demand, M could strengthen its rebound and build on the gains recorded over recent weeks.
Final Summary
- MemeCore’s 11% decline coincided with growing selling pressure in perpetual markets despite positive Spot Netflow.
- Whales accumulated while retail activity weakened, offering early signs of underlying confidence.