
$BNB trades at $590.05 on August 4, up 0.22%, holding above its short-term EMAs while a former employee memecoin scandal and an S&P Pantera index inclusion land in the same week.
$BNB Holds Short-Term EMAs but the Supertrend Is Still Overhead
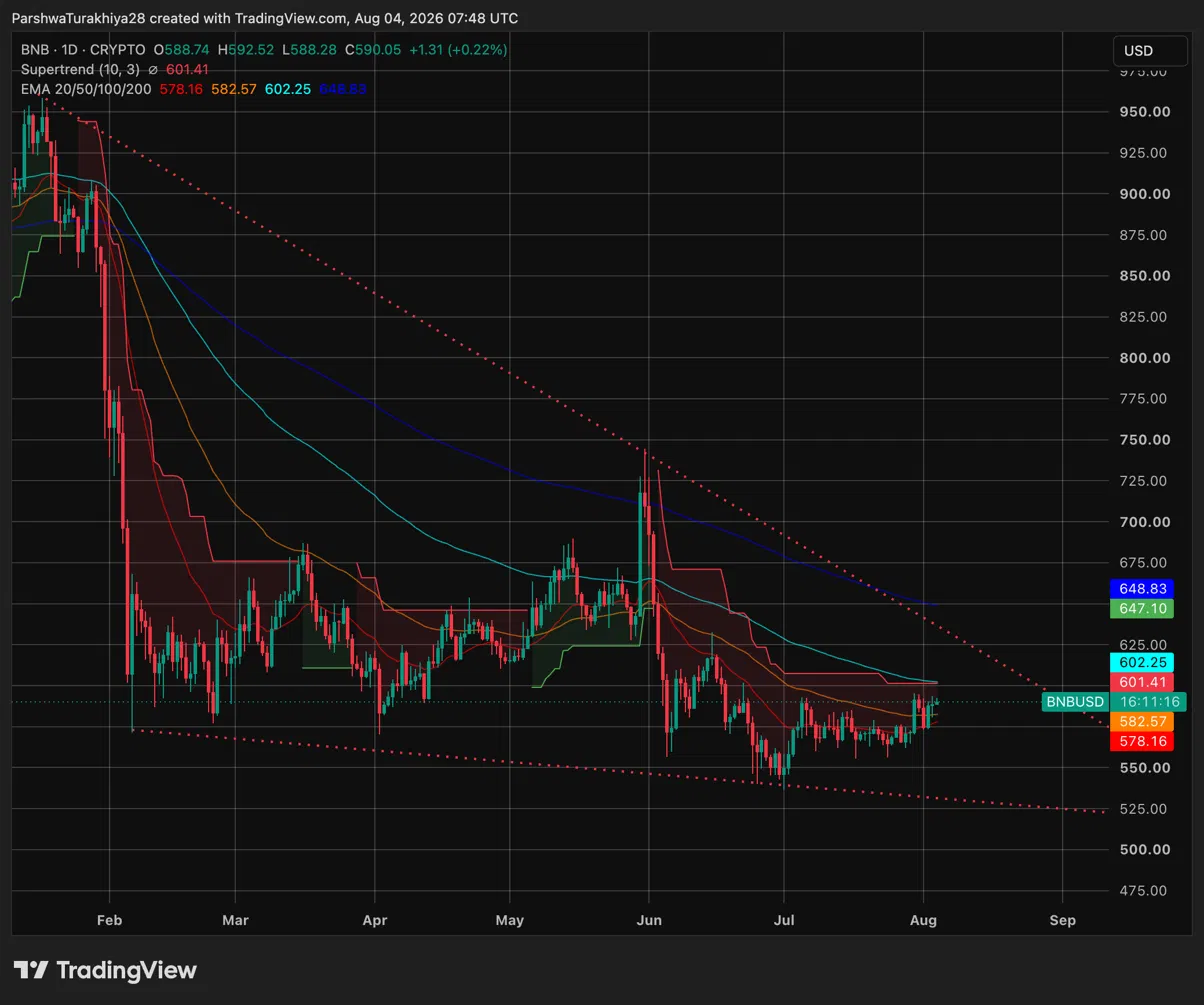
On the daily chart, $BNB is sitting just above the 20-day EMA at $578.16 and the 50-day at $582.57, both of which have been reclaimed in recent sessions. The Supertrend at $601.41 and the 100-day EMA at $602.25 form a tight cluster just above, making the $600 to $602 zone the key area to clear for August. The 200-day EMA at $648.83 is the next major target above that.
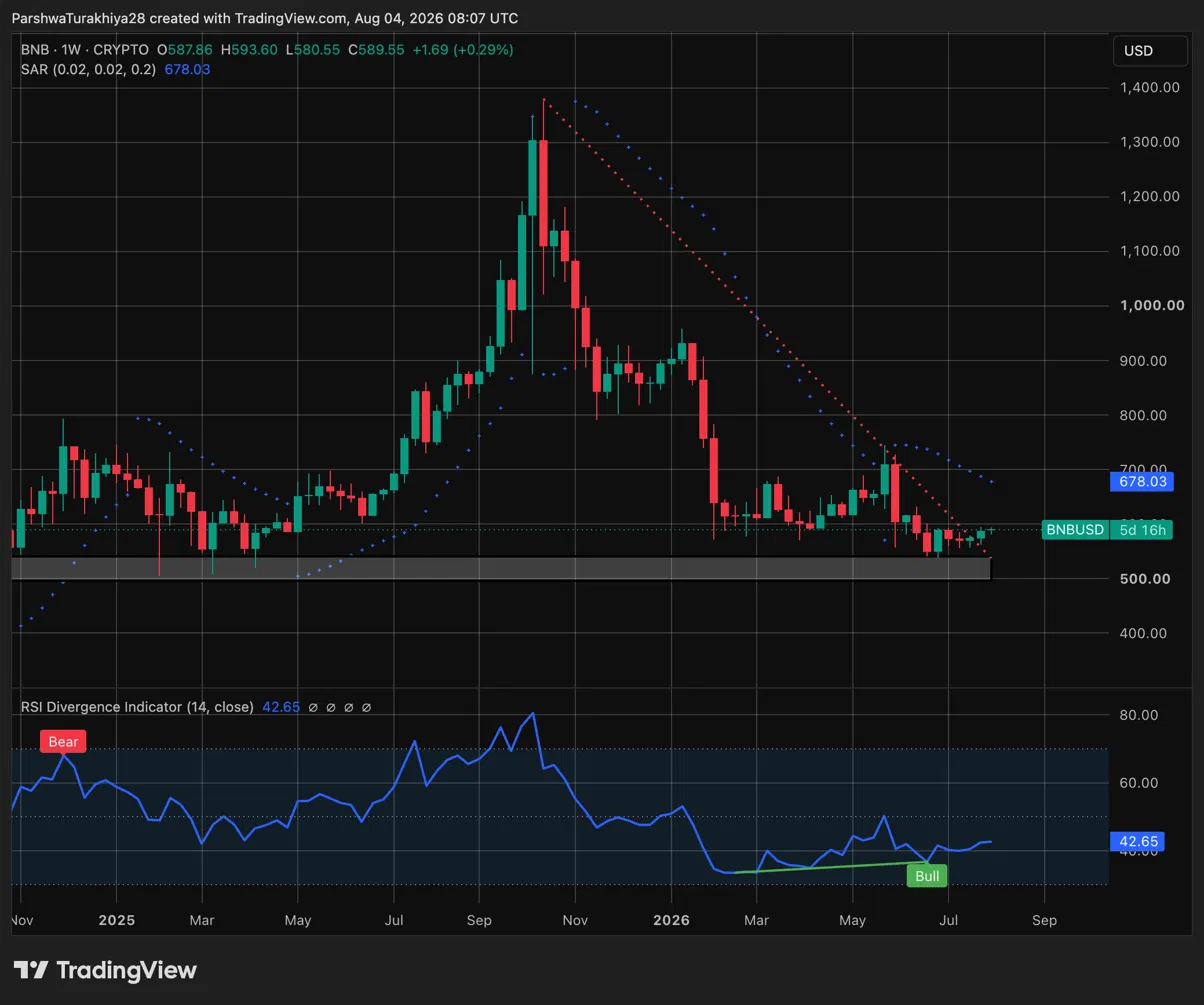
The weekly chart adds a more constructive layer. Weekly RSI at 42.65 is showing a bullish divergence signal, meaning price made a lower low while RSI made a higher low, a pattern that has historically preceded recoveries. The weekly SAR at $678.03 remains bearish above price, and a strong horizontal support zone near $500 to $520 has held on the weekly timeframe through the entire 2026 selloff.
Related: Cardano Price Prediction: ADA Surges 24% in a Week as Holders Drop and Strong Buyers Take Over
$BNB Support and Resistance Levels, August 2026
August Seasonality: The Average Flatters, the Median Is More Honest
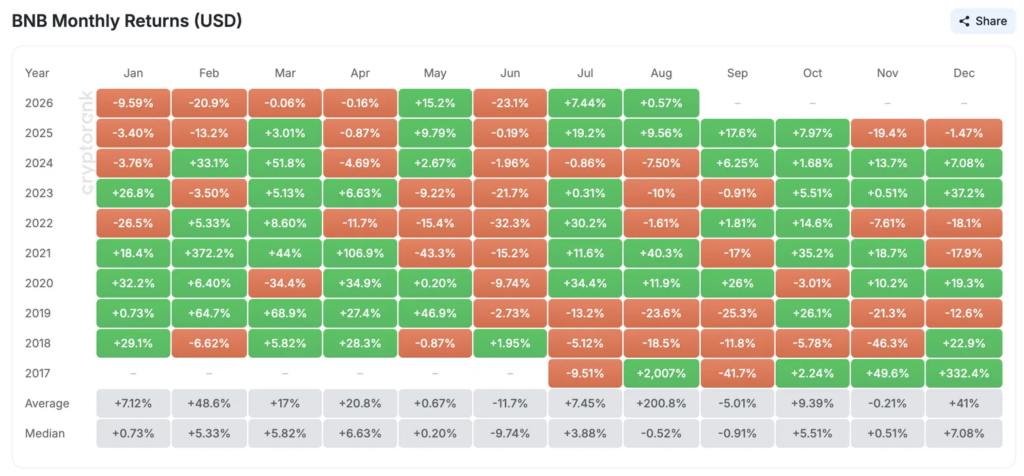
August’s average return for $BNB sits at +200.8%, but that number is almost entirely a product of 2017’s +2,007% reading. Strip that out and the picture is much more balanced. The median August return is -0.52%, and recent years have been mixed: +9.56% in 2025, -7.50% in 2024, and -10% in 2023.
Related: Top 3 Price Prediction: Bitcoin (BTC), Ethereum (ETH), And $XRP ($XRP)
$BNB has already printed +0.57% in the first few days of August 2026, entering the month from a base that followed a 23.1% June decline and a modest 7.44% July recovery.
$BNB Chain Ex-Employee Allegedly Pocketed $628K From $ASTEROID Memecoin
⚠️ ALERT: $BNB Chain says a former employee launched an unauthorized meme coin.
— Cointelegraph (@Cointelegraph) August 1, 2026
The employee allegedly reused an old wallet from their time at the company.
They say they're taking legal action.
Are your funds safu? pic.twitter.com/FwxL4auXmi
$BNB Chain announced on August 1 that it is pursuing legal action against a former employee who retained unauthorized access to a seed phrase after leaving the company. The individual allegedly used that seed phrase to generate a new private key and launch a memecoin called Asteroid Shiba, or $ASTEROID.
On-chain analytics account Lookonchain identified four wallets that spent around $10,000 to acquire 79.67% of $ASTEROID’s total supply, then sold the majority for approximately 1,103 $BNB, generating an estimated $628K in profit. $BNB Chain confirmed the wallet was originally created for a company video tutorial on token generation, and said it is cooperating with authorities, though it has not named an agency, jurisdiction, or case number. Changpeng Zhao reposted the statement and called the individual “basically a scammer.”
The exploit does not reflect a flaw in $BNB Chain’s network but raises questions about how tutorial wallets and seed phrases are managed when employees leave. $BNB Chain has not confirmed whether the same individual was involved in a 2025 incident where Binance suspended an employee over alleged token front-running.
S&P Pantera Index Places $BNB Second on Protocol Revenue
$BNB is second among the 18 constituents of @SPDJIndices and @PanteraCapital's new digital asset index, all screened on protocol revenue.
— $BNB Chain (@BNBCHAIN) August 3, 2026
Crypto benchmarks have typically measured what an asset is worth. Revenue only exists if people transact.
$BNB Chain averaged ~4.5 million… pic.twitter.com/gQYhHR3kIZ
$BNB ranked second among the 18 constituents of the S&P Pantera Digital Asset Index, screened entirely on protocol revenue rather than market cap. $BNB Chain averaged approximately 4.5 million daily active users through Q1 2026, giving it a verifiable revenue base that most altcoins cannot match.
The index is designed to give institutional capital a public benchmark for assets that actually generate economic activity, and $BNB’s second place finish puts it alongside Ethereum at the top of that screen.
$BNB August 2026 Weekly Forecast
$BNB Price Prediction August 2026: Upside and Downside Targets
Bullish Case, Target: $648.83 (200-day EMA)
$BNB clears the $600 to $602 Supertrend and 100-day EMA cluster on a daily close, confirming the weekly RSI bullish divergence is translating into price action. The S&P Pantera index inclusion attracts institutional attention, the $ASTEROID story fades as a one-off governance issue rather than a network flaw, and CLARITY Act progress before August 7 adds a macro tailwind. Price pushes toward the 200-day EMA at $648.83 and the weekly SAR at $678.03 by month end.
Bearish Case, Risk Level: $500 to $520 (Weekly Support Zone)
The $600 zone continues to reject price and the $ASTEROID scandal weighs on sentiment heading into the second week. $BNB loses the 20-day EMA at $578.16, and the weekly RSI bullish divergence fails to follow through as broader market risk-off pressure dominates. Price retests the $500 to $520 weekly horizontal support zone that has held since the June lows.
Related: Avalanche Price Prediction August 2026: Can AVAX Break $7 as Kenya Goes On-Chain?