
Bitcoin remains neutral on Wednesday after adding 1% to its value on Tuesday. The leading cryptocurrency is trading slightly below its 50-day Exponential Moving Average (EMA) at approximately $64,376 as of Wednesday.
Renewed institutional demand has supported the recovery, with US spot Bitcoin Exchange-Traded Funds (ETFs) recording consecutive daily inflows at the beginning of the week.
Traders are now preparing for Wednesday’s release of the Federal Open Market Committee Minutes.
The report could provide additional insight into the Federal Reserve’s interest-rate outlook as rising energy prices revive concerns about inflation.
Spot Bitcoin ETFs record $189 million inflow
Institutional demand for Bitcoin has improved this week. According to CoinGlass data, US spot Bitcoin ETFs recorded $189.30 million in net inflows on Tuesday. The result marked the second consecutive day of positive flows this week.
Continued ETF inflows could provide additional buying pressure and help $BTC extend its recent recovery.
Conversely, a return to sustained withdrawals could weaken institutional support and leave Bitcoin more exposed to changes in macroeconomic sentiment.
The renewed demand arrives as Bitcoin attempts to regain momentum following an extended period of trading below several important long-term technical indicators.
Investors are awaiting the FOMC Minutes for clues about how policymakers view inflation, economic growth and the future path of interest rates.
At its previous meeting, the Federal Reserve maintained its benchmark rate within a range of 3.50% to 3.75%. However, three voting officials dissented in favor of an increase, revealing disagreement within the committee about the appropriate policy stance.
A hawkish set of minutes suggesting that further tightening remains possible could push US Treasury yields and the US Dollar higher. Such a reaction would likely weigh on Bitcoin and other risk-sensitive assets.
Alternatively, indications that policymakers consider additional tightening unnecessary could support cryptocurrency valuations by improving expectations for future liquidity conditions.
According to analysts, the market’s response will depend less on whether the Fed changes rates immediately and more on how officials frame future financial conditions.
Bitcoin could face additional pressure if the minutes reinforce expectations of tighter policy. A more balanced or dovish message, however, could allow investors to rebuild a liquidity-driven bullish case for $BTC.
The FOMC Minutes arrive as rising crude oil prices increase uncertainty about the inflation outlook.
Oil climbed to a nearly three-week high amid continued tensions between the United States and Iran over the Strait of Hormuz.
US President Donald Trump said Washington was not negotiating with Tehran and that the naval blockade of Iranian ports remained in place.
Trump also published a map on Truth Social depicting the strategically important Strait of Hormuz as new US territory.
Meanwhile, Iranian Parliament Speaker Mohammad Bagher Ghalibaf said the waterway would remain closed until the US fulfilled conditions contained in a June memorandum of understanding that has since expired.
The standoff is keeping a geopolitical risk premium in oil prices. Higher energy costs could feed into broader inflation and make it more difficult for the Federal Reserve to ease monetary policy.
Bitcoin technical forecast: $BTC tests support at the 50-day EMA
Bitcoin is trading at approximately $64,210 on Wednesday, slightly below its 50-day EMA at $64,376.
A sustained surge above the 50-day EMA could preserve Bitcoin’s short-term recovery attempt, but $BTC remains below the 100-day EMA at $66,334 and the 200-day EMA at $71,451.
This positioning indicates that the broader technical structure remains capped despite the recent improvement.
The Relative Strength Index stands near 56, reflecting broadly neutral momentum with a mild bullish bias.
Meanwhile, a positive Moving Average Convergence Divergence reading suggests that buying momentum is gradually improving. However, neither indicator has confirmed a decisive bullish breakout.
Bitcoin’s first significant resistance is located at the 38.2% Fibonacci retracement level of $65,547.
The retracement is measured from the May 26 high of $78,080 to the 2026 low of $57,800 recorded on July 1.
Above that level, $BTC could encounter additional selling pressure around the 100-day EMA at $66,334 and the horizontal resistance at $66,500.
A sustained daily close above $66,500 would strengthen the bullish outlook and could open the way toward the 50% Fibonacci retracement at $67,940.
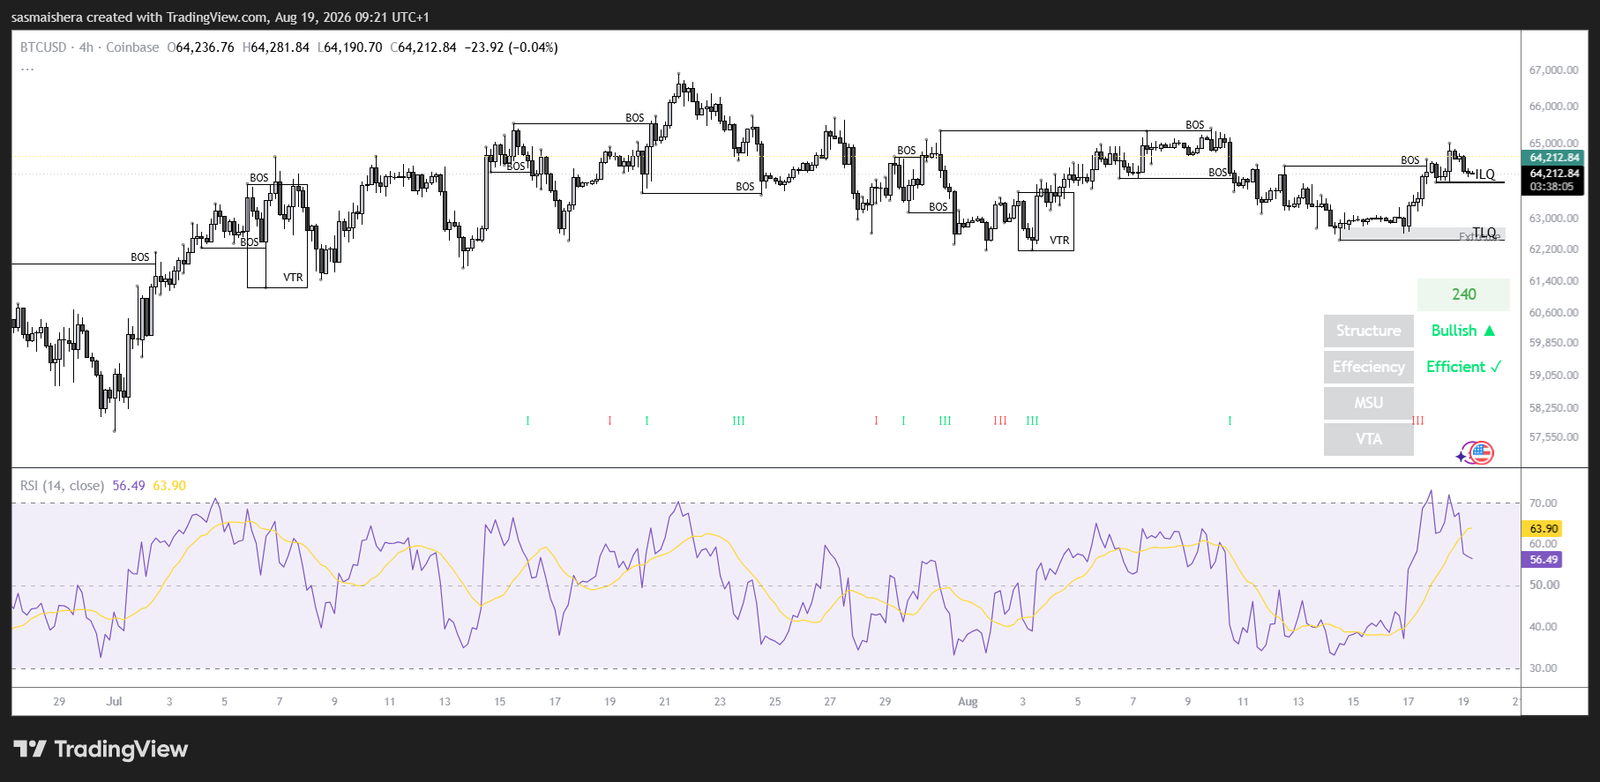
The 200-day EMA at $71,451 would remain the broader trend ceiling if Bitcoin extends its recovery.
On the downside, a daily close below the 50-day EMA at $64,376 would weaken the short-term outlook.
$BTC could then decline toward the 23.6% Fibonacci retracement at $62,586, followed by the horizontal support level at $62,300.
Bitcoin’s next directional move may depend on whether ETF inflows continue and how markets interpret the Federal Reserve’s policy message.