
The Bitcoin Rainbow Chart projects that Bitcoin ($BTC) will remain in its deepest undervaluation zone heading into August 1, 2026.
In this line, data from BlockchainCenter’s Dynamic Rainbow Chart shows Bitcoin’s valuation range for August 1 stretching from roughly $63,400 at the bottom of the rainbow to approximately $517,500 at the top.
The model’s fair-value ‘HODL’ zone stands at around $181,200, nearly three times Bitcoin’s current price.
With Bitcoin trading at $62,655, the cryptocurrency sits marginally below the chart’s lowest ‘Basically a Fire Sale’ band.
For August 1, the chart places the ‘BUY!’ zone at approximately $82,500, the ‘Accumulate’ band at $107,200, and the ‘Still Cheap’ zone at $139,400.
Above the ‘HODL’ band, the model identifies $235,600 as the ‘Is This a Bubble?’ level, $306,200 as the ‘FOMO Intensifies’ zone, $398,100 as the ‘Sell. Seriously, SELL!’ band, and roughly $517,500 as ‘Maximum Bubble Territory.’
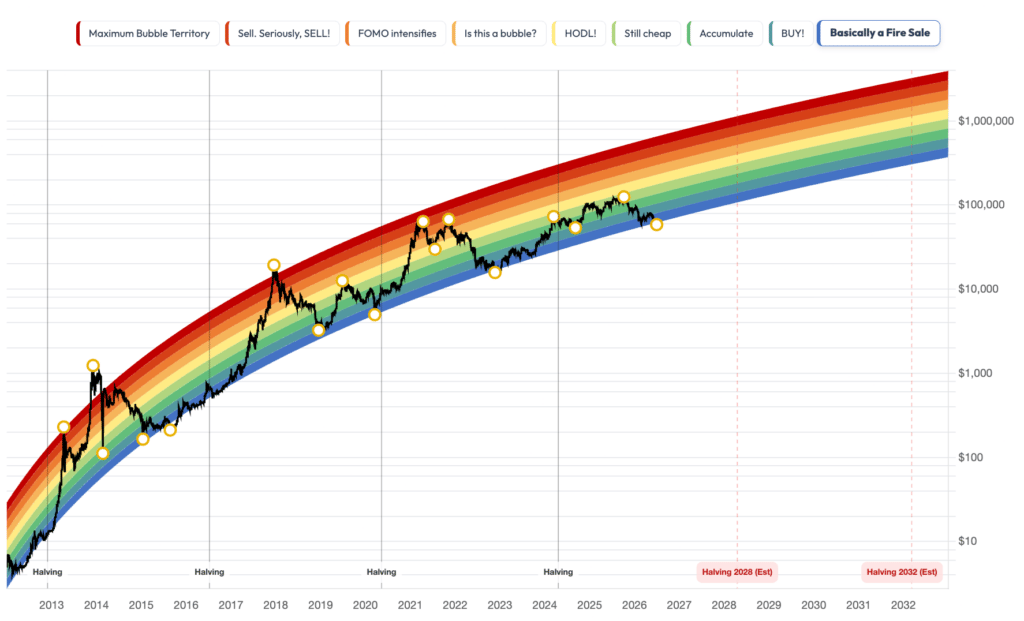
Bitcoin’s current price places it below the ‘Fire Sale’ threshold of $63,440, a level historically reached only during severe bear markets.
Similar readings appeared after the FTX collapse in late 2022, with previous visits to the deepest blue bands often preceding significant long-term recoveries.
Bitcoin’s 2026 bearish case
Bitcoin’s position on the chart follows a sharp correction from its October 2025 all-time high of $126,198.
The decline accelerated in 2026 as the Federal Reserve kept rates elevated, while spot Bitcoin ETFs recorded a record $4.5 billion in June outflows, helping push $BTC to a 21-month low of $58,115.
Attention is now on the Fed’s July 28-29 meeting, with markets pricing in a 70% chance of another rate hold.
A hawkish outcome could send Bitcoin back toward $58,115, while a dovish surprise may support a move toward $65,600 and potentially $70,000.
Based on these scenarios, Bitcoin could trade between $58,000 and $66,000 on August 1. Even at the upper end of that range, $BTC would remain within or only slightly above the Rainbow Chart’s deepest undervaluation bands, needing to surpass $63,440 to exit the ‘Fire Sale’ zone and $82,500 to move beyond the ‘BUY!’ band.
Notably, the Bitcoin Rainbow Chart maps Bitcoin’s price against a long-term logarithmic trend. Its latest Dynamic version updates daily using a Power Law regression based on Bitcoin’s full price history since 2012, with a reported fit strength of 94.3%.
BlockchainCenter emphasizes that the Rainbow Chart is not a predictive tool or investment advice.
Because the model recalculates daily, its valuation bands change over time, making them a snapshot of Bitcoin’s historical trend rather than a forecast of future prices.