
As of July 22, 2026, the Bitcoin price today sits at $65,901.68 — a level that tells two very different stories depending on the timeframe you consult. On the daily chart, $BTC appears to be recovering. On the hourly, it is already stalling.
Key takeaways
- Bitcoin trades at $65,901.68 on July 22, 2026, below the daily pivot of $66,114.19, leaving bulls without structural control.
- The daily MACD histogram at 377.62 signals building momentum, yet hourly indicators reveal fading short-term strength.
- The Fear & Greed Index sits at 33, reflecting cautious positioning rather than capitulation.
- The $65,488–$66,527 range now defines the battlefield that will likely determine medium-term direction.
- The Clarity Act regulatory catalyst sparked a brief rally but failed to trigger a decisive breakout.
A Market Caught in No Man’s Land
Bitcoin is trading in a technical no-man’s-land where daily recovery momentum clashes with hourly exhaustion signals. The dominant market force right now is not bullish conviction. It is indecision, flavored with cautious optimism after Treasury Secretary Bessent publicly stated the Clarity Act is at the “1-yard line.” That regulatory catalyst sparked a brief rally, according to Bloomberg reporting from July 21. The policy signal is real, but the price action response has been measured rather than explosive.
Meanwhile, the broader crypto market cap sits at approximately $2.33 trillion with a 24-hour decline of about 0.60%, per CoinGecko data. Bitcoin dominance holds firm at 56.74%. This means capital is not rotating aggressively into altcoins. Traders are staying close to the reserve asset — a classic sign of cautious positioning rather than full-risk-on behavior. The Fear & Greed Index reading of 33 — firmly in Fear territory — confirms this. Participants have not capitulated, but they have not committed either.
The Daily Chart Sets the Macro Bias
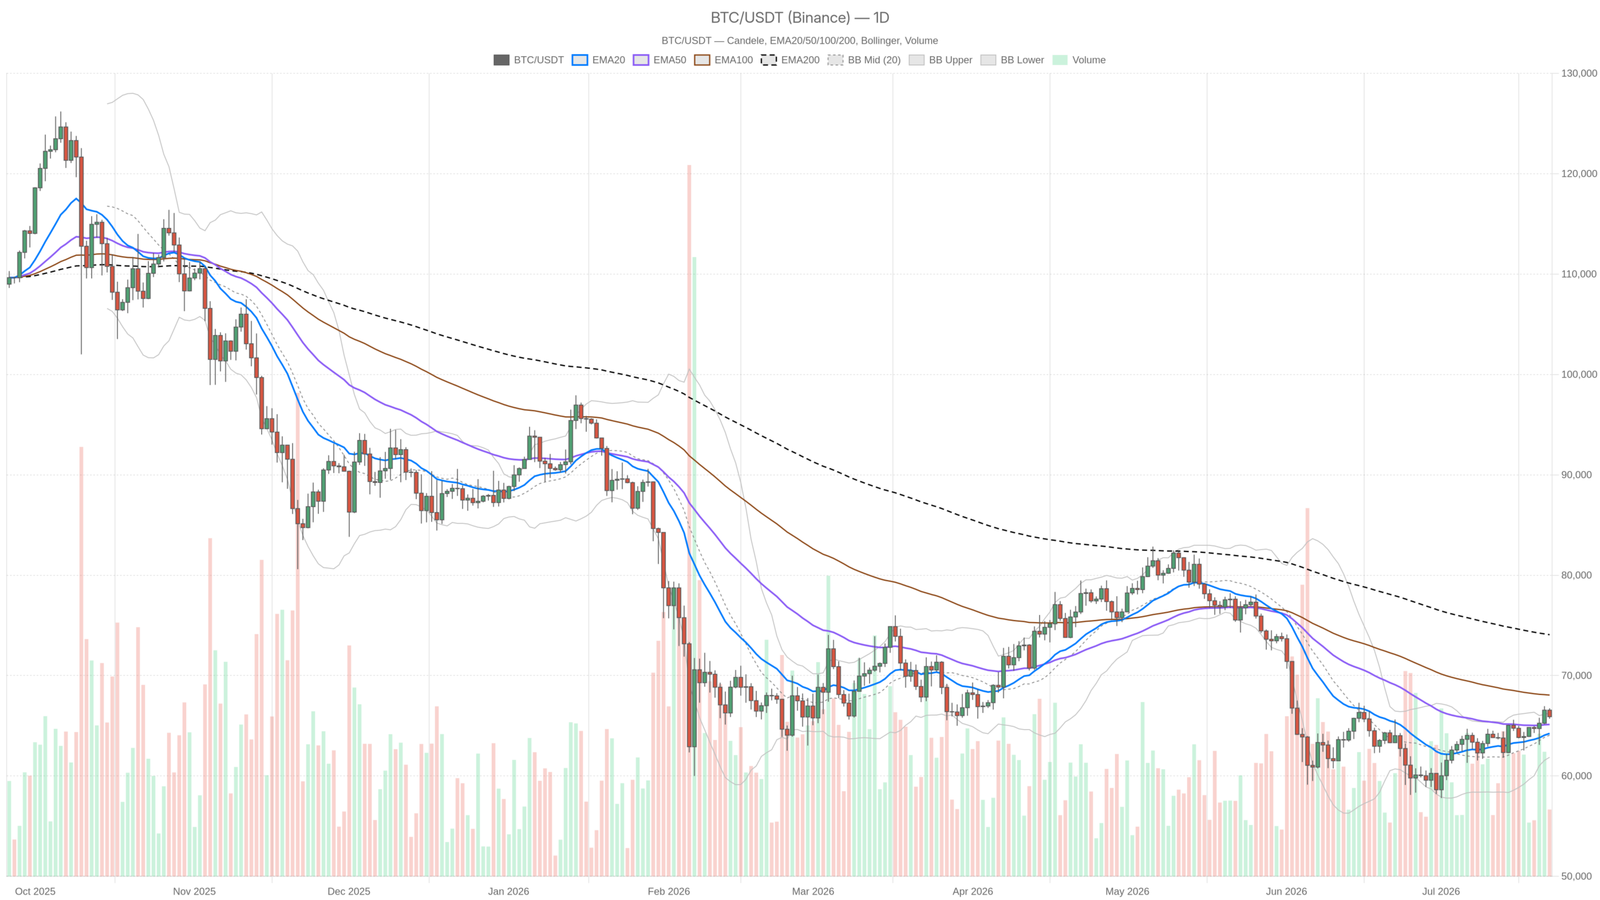
The daily chart leans constructive, with Bitcoin trading above both the EMA20 and EMA50, though important caveats remain. $BTC is above the EMA20 at $64,235 and the EMA50 at $65,132. That is a meaningful short-term alignment, suggesting the recent recovery has genuine technical footing. The MACD histogram on D1 is positive at 377.62, with the MACD line at 572.40 running well above the signal at 194.78. Histogram expansion of this kind typically reflects building upside momentum, not fading strength.
Moreover, RSI at 58.05 sits in healthy territory — above the 50 midline but not yet overbought — which gives the move room to breathe without screaming exhaustion. The Bollinger Band picture adds nuance. Price is pressing toward the upper band at $66,262.95, with the midline at $64,061.54 acting as a dynamic floor. Trading in the upper half of the band is constructive. However, pushing against the upper boundary also implies natural resistance overhead. The daily ATR of $1,553.49 signals that any directional move is likely to carry real range in either direction.
The daily pivot sits at $66,114.19, with R1 at $66,527.38 and S1 at $65,488.49. Price is currently below the pivot — a subtle but telling detail. Sitting just beneath the daily pivot point means bulls have not yet retaken the structural fulcrum for this session. One figure undercuts any narrative of recovery being complete: the EMA200 at $74,072.78. Bitcoin is trading nearly $8,000 below its long-term moving average. A Bloomberg piece from July 17 described $BTC halving in value since October. While the daily setup looks like a base is forming, the distance to the EMA200 is a sobering reminder of how much ground the asset has lost. This is repair work, not a new bull run.
Hourly Timeframe: Where Momentum Starts Fraying
On the 1-hour chart, short-term momentum has begun to fray, with price sitting below the EMA20 and the MACD histogram turning negative. Price at $65,901.68 sits below the H1 EMA20 at $66,145.21 and just above the EMA50 at $65,819.54. The EMA200 on this timeframe at $64,787.01 offers support from below, but the short-term EMAs have flipped to mild bearish alignment. The MACD on the hourly confirms this: the histogram is negative at -108.25, with the line at 15.34 still lagging below the signal at 123.59.
The RSI at 44.98 is below the neutral 50 line — not in distress, but lacking the energy to push higher right now. Furthermore, the hourly Bollinger Band midline at $66,314.35 sits above current price. In practical terms, the market needs to close back above that level to restore short-term bullish control. The H1 pivot at $65,955.52 is also just marginally above the current close — yet another micro-resistance cluster price has not cleared. None of these signals are catastrophic, but together they paint a picture of a market that has cooled since the regulatory catalyst headline hit on July 21 and now lacks a fresh trigger to push through the overhead supply.
15-Minute Context: Stabilization, Not Strength
The 15-minute chart shows stabilization rather than renewed strength, with selling pressure potentially losing momentum at the micro level. RSI at 40.94 is soft, though the MACD histogram has ticked slightly positive at 17.52. The line at -81.24 remains below the signal at -98.76, but the histogram crossing above zero is a tentative sign that selling on this micro-timeframe may be exhausting itself. Price on M15 is below all three EMAs — the 20 at $66,020, the 50 at $66,153, and the 200 at $65,838 — except it is hovering just above the EMA200, which now acts as immediate support. That EMA200 on the 15-minute chart is the last line of short-term defense.
Bullish Scenario: What Would Need to Happen
Bulls need to reclaim the daily pivot at $66,114.19 and push through R1 at $66,527.38 to establish genuine control. A clean close above that level, followed by a push past the upper Bollinger Band at $66,262.95, would signal that daily momentum has genuinely transferred into intraday structure. The 1-hour EMAs would need to re-align bullishly — specifically, price sustaining above $66,145 — and the MACD histogram on the hourly would need to flip positive. If the Clarity Act narrative gains further legislative traction and spills into another news cycle, that fundamental catalyst could provide the fuel. In that case, the next logical target cluster sits around the $66,500–$67,000 zone. The bullish scenario is invalidated if price breaks and holds below the H1 EMA50 at $65,819 and subsequently the daily S1 at $65,488.
Bearish Scenario: The Stall Becomes a Rollover
The bear case simply requires continued failure at overhead resistance, with a break below $65,800 opening the door to deeper support tests. If $BTC cannot reclaim the hourly EMA20 and the daily pivot, sellers maintaining pressure below that level open a path to a retest of the $65,488 S1. From there, a slide toward the Bollinger Band midline at $64,061.54 becomes plausible. The daily ATR of $1,553 means a single-session move of that magnitude is entirely possible without breaking any technical rules. With the Fear & Greed Index at 33, sentiment does not have far to fall before it tips into deeper fear. That is when mechanical stop-hunting tends to accelerate. The bearish scenario is invalidated by a sustained daily close above $66,527.
Positioning Through Uncertainty
The honest read on the Bitcoin price today is this: the daily foundation is being rebuilt, but it remains unfinished. The macro structure — daily MACD, EMA alignment, RSI above 50 — argues for patience on the long side. However, the hourly and 15-minute charts are not confirming that thesis right now. Traders who entered long on the regulatory catalyst headline may already be sitting on fading momentum. The proximity to multiple resistance levels means the risk of a whipsaw is non-trivial.
With ATR still elevated and sentiment in fear, volatility is not going away. Anyone with a position in either direction should map their levels clearly. The $65,488–$66,527 range is the current battlefield. How price behaves within it over the next 24 to 48 hours will likely define the medium-term direction more than any single news headline. The regime across all three timeframes is tagged as neutral, and that is probably the most honest description available right now.
FAQ
What is Bitcoin’s price today?
Bitcoin trades at $65,901.68 as of July 22, 2026, sitting below the daily pivot of $66,114.19 and above the daily S1 support at $65,488.49.
Why is Bitcoin struggling to break higher?
Multiple resistance levels are compressing price action. The daily pivot at $66,114.19, the upper Bollinger Band at $66,262.95, and the H1 EMA20 at $66,145.21 all sit above the current price, creating a dense overhead supply zone that bulls have not yet cleared.
What would confirm a bullish breakout?
A clean daily close above R1 at $66,527.38, accompanied by the 1-hour EMAs realigning bullishly and the hourly MACD histogram flipping positive, would confirm that daily momentum has transferred into the intraday structure.
What is the key bearish risk level?
A sustained break below the daily S1 at $65,488 could open a path toward the Bollinger Band midline at $64,061.54. With the daily ATR at $1,553.49, a move of that magnitude is plausible within a single session.
Disclaimer: This article is for informational purposes only and does not constitute financial advice, an investment recommendation, or a solicitation to buy or sell any financial instrument or cryptocurrency. The analysis provided is not indicative of future results. Investing in crypto assets and financial markets carries a high risk of capital loss. Always do your own research (DYOR) and consult a qualified financial advisor before making any decision.
Article produced with the assistance of artificial intelligence and reviewed by the editorial team.