
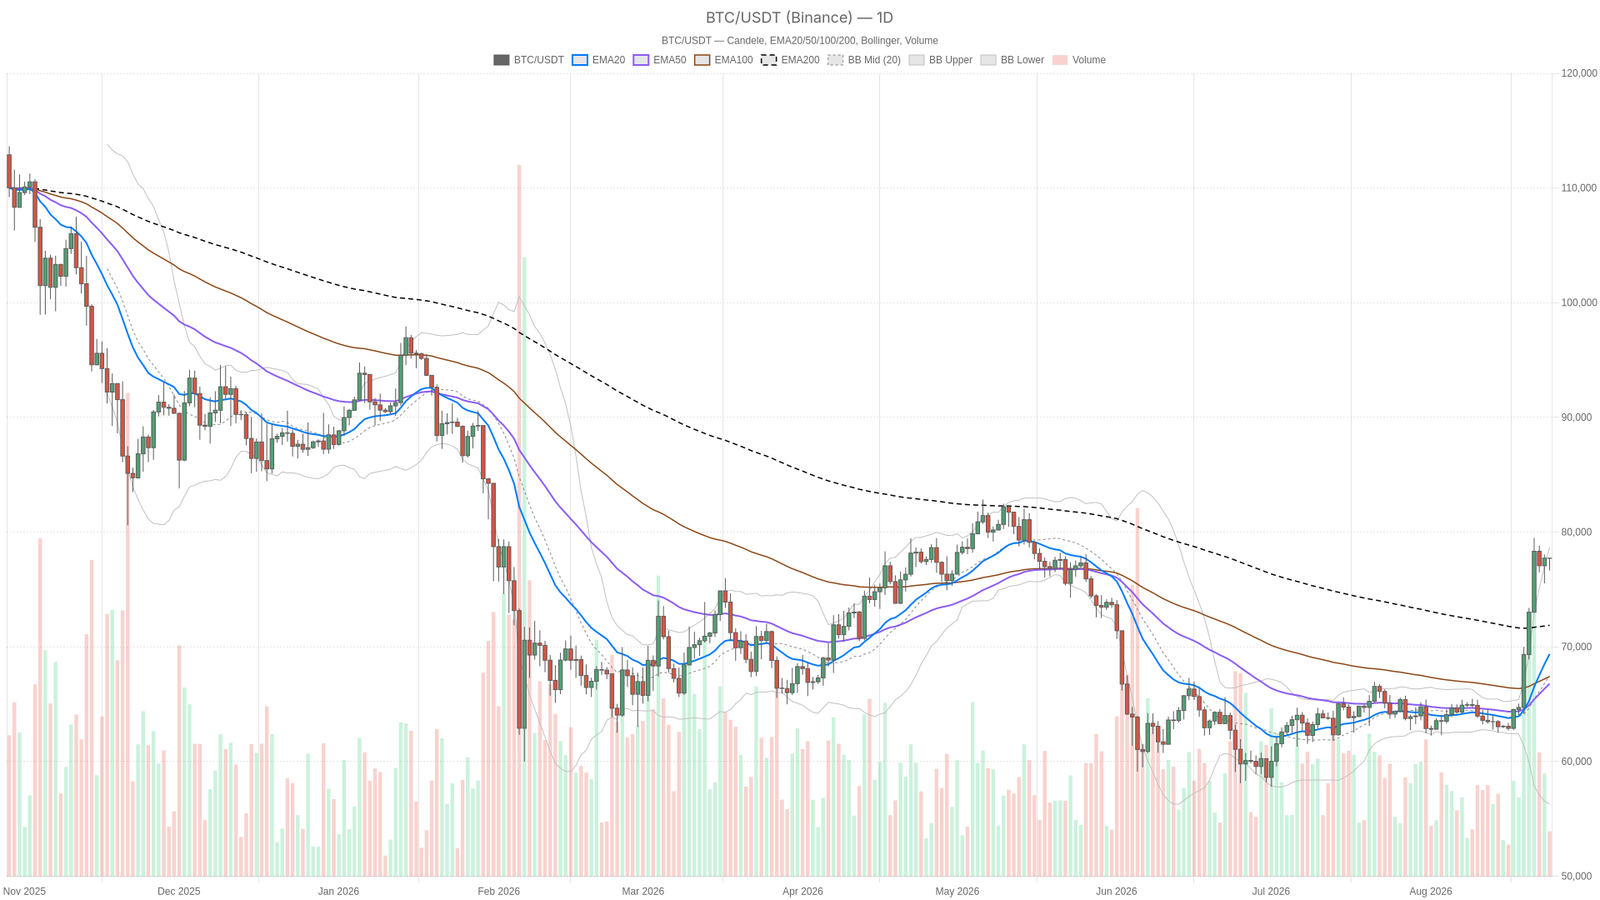
As of August 24, 2026, the bitcoin price today sits near $77,720, just beneath the psychological $80,000 level. A macro-driven short squeeze pushed $BTC well above its key moving averages, leaving traders to assess whether the rally can sustain itself at these stretched levels.
Key takeaways
- Bitcoin trades at $77,720 with daily RSI at 80.75, deep in overbought territory
- Daily EMAs show: 20-day at $69,375, 50-day at $66,795, 200-day at $71,881
- The 1H MACD histogram has turned negative, signaling short-term momentum fatigue
- Sentiment gauge at 73 (“Greed”) alongside elevated daily ATR of $2,239.36
- $BTC dominance at 59.24% as capital concentrates in the leading crypto asset
Trend Strength vs. Overheated Conditions
The daily trend carries real structural backing, yet the RSI at 80.75 signals the market has run too far, too fast. Bitcoin trades well above its 20-day EMA at $69,375, 50-day EMA at $66,795, and 200-day EMA at $71,881. However, the 20-day EMA sits below the 200-day EMA, which differs from a textbook bullish stack alignment.
However, the daily RSI reading deep in overbought territory indicates very little room left to run before buyers need a pause. Interestingly, despite the strong MACD, the system’s daily regime classification still tags conditions as “neutral.” This serves as a reminder that trend strength and exhaustion can coexist, and that momentum alone does not guarantee continuation.
Moreover, the daily MACD backs the bullish case: the line sits at 3,334.57 against a signal of 1,745.26, producing a wide histogram of 1,589.31. That reflects real momentum, not a fading push. Price is also riding the upper Bollinger Band at 78,690.55 against a close of 77,720 — a market pressing against its statistical ceiling. It is not a sell signal by itself, but any hesitation from buyers could trigger a snap back toward the 67,491 midline if sentiment shifts.
Where Momentum Starts to Crack: The 1H Picture
Short-term momentum on the 1-hour chart shows early signs of fatigue, even as the EMA structure remains firmly bullish. The 1H regime is labeled bullish, and price sits above the 20, 50, and 200-period EMAs at 77,285, 76,894, and 72,037 respectively. RSI at 56.73 is comfortably neutral — a positive sign for continuation, as there is room to push higher without hitting overbought exhaustion on this timeframe.
However, the MACD tells a different story: the line at 87.1 has slipped below the signal at 87.42, producing a small negative histogram of -0.33. That is momentum stalling right at the point where the daily chart is most stretched. It is not a reversal signal yet, but it warns that the short-term push is losing steam precisely when it needs strength the most.
Meanwhile, the 1H Bollinger Bands show price at 77,706, sitting between the mid-band at 77,356 and the upper band at 77,895 — a fairly tight, controlled range rather than a breakout structure. Price is above the pivot point at 77,653.50 but has not cleared R1 at 77,842.69. This means buyers control the immediate structure without having forced a decisive breakout yet.
15-Minute Execution Context
The 15-minute chart reveals a tightly coiled market sitting just beneath resistance. EMAs are tightly bunched at 77,341, 77,315, and 77,117, which typically signals consolidation rather than trending conviction. RSI at 60.26 and a positive MACD histogram of 78.61 suggest a small fresh push of buying pressure is building, even as higher timeframe momentum cools.
Price is essentially glued to the upper Bollinger Band at 77,719.61 with a close of 77,702.01, meaning short-term upside is capped unless buyers force a clean break above that level. The 15-minute pivot resistance at 77,740.67 sits barely above current price. This is a market coiled tightly under resistance, waiting for a trigger in either direction.
The Bigger Picture: Sentiment, Dominance and the Catalyst
Bitcoin’s dominance at 59.24% confirms that capital rotated into the majors rather than spreading across the crypto space during this move — even as altcoin platforms like Hyperliquid grabbed headlines of their own. Total crypto market cap actually slipped 0.67% over 24 hours, meaning the broader market did not share fully in Bitcoin’s strength. The Fear & Greed Index reading of 73 (“Greed”) confirms sentiment has gotten hot alongside the price action — a combination worth taking seriously as a warning sign when paired with the daily RSI overextension.
The catalyst behind this leg is fairly clear: a Treasury-related move triggered a short squeeze that violently repriced bets against Bitcoin staying under $67,000. Fiscal and debt-crisis concerns, echoed by voices like Ray Dalio recommending gold and bitcoin exposure, have reinforced a scarce-asset demand narrative. That is a real macro tailwind, not just technical froth, which explains why the daily trend structure still looks intact even as short-term indicators flash caution.
Bullish Scenario
A bullish continuation requires buyers to clear daily R1 at $78,116.79 and push through the upper Bollinger Band near $78,690. That would open the path toward fresh highs, especially with the fiscal-driven scarce-asset narrative still active. Confirmation would come from the 1H MACD flipping back positive and the 15-minute chart breaking cleanly above its upper band. This scenario would be invalidated if price fails to reclaim R1 and instead rolls below the 1H EMA cluster at 76,894–77,285 — signaling the squeeze has run its course.
Bearish / Mean-Reversion Scenario
A pullback toward the daily pivot at $77,393.40 or S1 at $76,996.61 is a realistic near-term outcome, given the daily RSI at 80.75 and the 1H MACD already turning negative. This could unfold even within an intact uptrend. A deeper mean-reversion move — toward the daily EMA20 near $69,375 or the Bollinger mid-band at $67,491 — would require a clear breakdown of 1H structure below $76,817, not just a shallow dip.
Conversely, the bearish case would be invalidated if price holds above the daily pivot and the 1H MACD re-accelerates higher without RSI diverging. That would indicate the market absorbed the overbought reading through time rather than through a price decline.
Positioning and Risk
Right now the honest read on bitcoin price today is a market with genuine trend strength on the daily chart colliding with overbought conditions, while short-term momentum on the 1H already shows early signs of fatigue. That tension typically precedes either a healthy pause-and-continue pattern or a sharper corrective move, and the data does not cleanly favor one outcome over the other.
Daily ATR at $2,239.36 confirms volatility is elevated, so whichever direction this resolves in, the moves are likely to be large in dollar terms. With sentiment already running hot at a Fear & Greed reading of 73, this is a moment that rewards patience over conviction. Watching how price behaves around the daily pivot and R1 levels will likely prove more useful than any single indicator on its own.
FAQ
Is Bitcoin overbought right now?
Yes, the daily RSI sits at 80.75, which is deep into overbought territory. While this does not guarantee an immediate reversal, it indicates limited room for further upside before buyers need a pause to absorb gains.
What triggered the recent bitcoin rally?
A Treasury-related macro development triggered a short squeeze that violently repriced bets against Bitcoin staying below $67,000. Additionally, fiscal and debt-crisis concerns, echoed by voices like Ray Dalio recommending gold and bitcoin exposure, reinforced a scarce-asset demand narrative.
What are the key support levels to watch?
The daily pivot at $77,393.40 and S1 at $76,996.61 are the nearest support levels. A deeper mean-reversion move would target the daily EMA20 near $69,375 or the Bollinger mid-band at $67,491, though this would require a clear breakdown of the 1H structure below $76,817.
Is the bitcoin rally likely to continue?
The daily trend structure remains intact with bullish EMA alignment and strong MACD readings. However, short-term momentum indicators on the 1H chart show early fatigue, and overbought conditions on the daily RSI suggest a pause or pullback is a realistic near-term outcome before any further upside.
Disclaimer: This article is for informational purposes only and does not constitute financial advice, an investment recommendation, or a solicitation to buy or sell any financial instrument or cryptocurrency. The analysis provided is not indicative of future results. Investing in crypto assets and financial markets carries a high risk of capital loss. Always do your own research (DYOR) and consult a qualified financial advisor before making any decision.
Article produced with the assistance of artificial intelligence and reviewed by the editorial team.