
Trading at $64,290 on July 20, 2026, the Bitcoin price today reflects a market compressed between conflicting signals. A damaged macro structure collides with the first constructive short-term momentum in weeks. This is not a breakout or breakdown — it is the kind of tight range that precedes a decisive move.
Key takeaways
- $BTC trades at $64,290, stuck in a narrow range between daily bullish momentum and hourly selling pressure.
- The Fear & Greed Index has dropped to 29, signaling cautious sentiment across the broader crypto market.
- Strategy holds a $3 billion reserve and continues accumulating Bitcoin, providing an institutional demand floor.
- The daily MACD histogram at +267.79 suggests easing selling pressure, but the 1H chart remains bearish.
- Compressed Bollinger Bands across multiple timeframes point to an imminent volatility expansion.
The Daily Chart: A Market Trying to Recover Its Footing
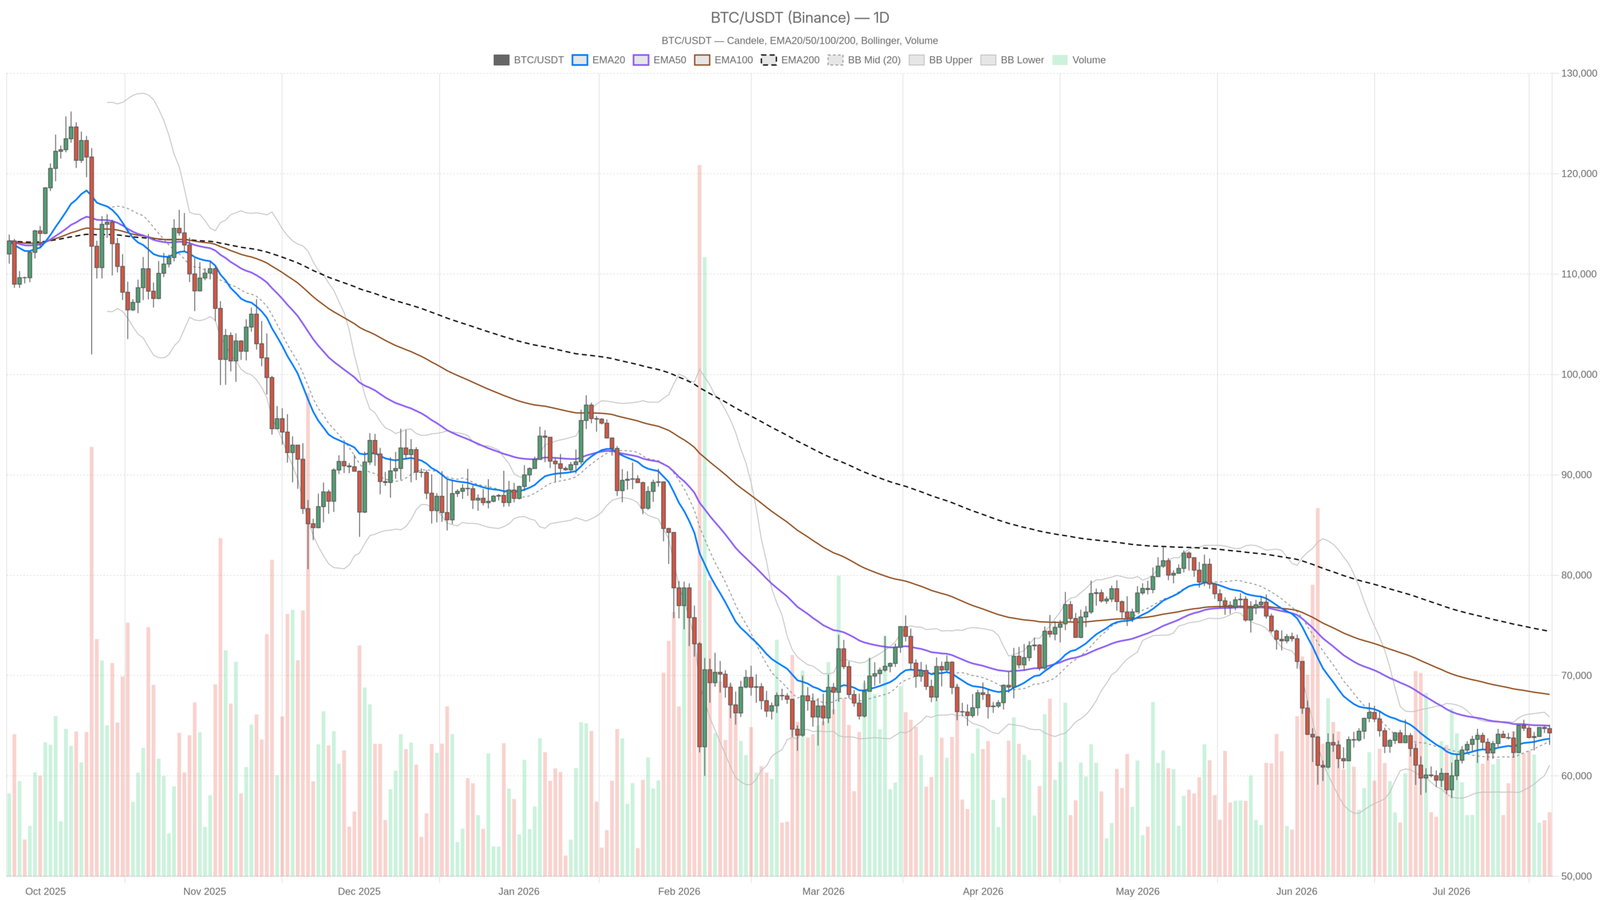
The daily timeframe is where the real story lives. Bitcoin dominance holds at 56.4%, signaling that capital is not rotating into altcoins. The regime is officially tagged as neutral, but the details matter. Price at $64,290 has managed to close above the EMA20 at $63,705 — a small but meaningful development. However, it still trades beneath the EMA50 at $65,003. The EMA200 at $74,405 is a brutal reminder of how far $BTC has fallen. That long-term average frames the macro reality: this market is in recovery mode, not trend mode.
The MACD on the daily is arguably the most interesting data point right now. The MACD line has crossed to +253.23 above a signal line still negative at -14.56, producing a histogram of +267.79. Notably, that kind of expanding positive histogram after prolonged compression is a classic early-stage momentum shift signal. It is not a confirmation of a new bull run, but a warning to bears that selling pressure is genuinely easing. The RSI at 52.52 corroborates this: above the neutral 50 line, not overbought, not oversold — just quietly tilting bullish.
Bollinger Bands on the daily place the midline at $63,469, the upper band at $65,869, and the lower band at $61,069. Price trading above the midline while the bands themselves are not dramatically wide suggests the market has not yet committed to volatility expansion. The ATR of $1,576 confirms this — daily ranges are meaningful but not chaotic. Moreover, the daily pivot sits at $64,166, with R1 at $65,231 and S1 at $63,224. Price trading just above the pivot and beneath R1 puts it exactly in no-man’s land.
Hourly Tension: Where the Bullish Case Gets Complicated
On the 1-hour chart, however, the picture becomes immediately less flattering. Price at $64,285 is trading below both the EMA20 ($64,402) and EMA50 ($64,397) — the two are essentially converged, and price cannot hold above them. The EMA200 on the hourly at $64,084 acts as support from below, which is the only reason this does not look overtly bearish. The MACD on the 1H is negative: line at -85.48, signal at -36.37, histogram at -49.10 and still deteriorating. That is active short-term selling pressure, not exhaustion.
RSI on the 1H at 46.46 is sub-50 — not crashed, but leaning bearish. The Bollinger Bands on this timeframe are narrow, with the upper band at $64,949 and the lower at $63,968. This indicates a low-volatility squeeze on the intraday level. The ATR of $440 means even a normal hourly range barely covers a meaningful price distance. In fact, this is a market that wants to move but lacks the volume conviction to do it yet. The hourly pivot at $64,249 with R1 just at $64,336 shows how compressed the intraday structure has become.
15-Minute Execution Context: A Small Spark of Recovery
The 15-minute chart offers one mildly encouraging data point for bulls. While the MACD line remains negative at -63.86, the histogram has flipped positive to +38.56 — the signal line at -102.42 is being pulled up from the bottom. This is an early sign of micro-level momentum reversal, the kind of divergence that sometimes precedes a short-term bounce. RSI at 50.46 is dead neutral. Price at $64,285 has reclaimed the EMA20 at $64,235 on this timeframe, which is the smallest of green flags for anyone looking for a near-term entry. The ATR of $194 keeps the expected move per 15-minute candle modest.
The Bullish Scenario
The bullish setup has a coherent logic. The daily MACD crossover is real and the histogram is expanding. RSI on D1 just crossed 50. Price is above the daily EMA20 and the daily pivot. If $BTC can absorb the selling pressure on the 1H and push through the hourly EMA50 cluster ($64,397–$64,402), the next target becomes the daily R1 at $65,231. Beyond that lies the upper Bollinger Band at $65,869. Strategy’s continued accumulation — with a $3 billion reserve and publicly stated intent to buy more — provides an institutional demand floor that cannot be entirely dismissed. This scenario is invalidated if price loses the daily EMA20 at $63,705 on a closing basis, which would suggest the MACD crossover was a false dawn.
The Bearish Scenario
The bear case has gravity on its side. The EMA200 on the daily is still more than $10,000 above current price, meaning the broader trend remains structurally bearish. The 1H MACD is negative and the histogram is deepening — that reflects real short-term supply. The Fear & Greed Index at 29 shows the market is not buying dips with conviction. Moreover, an oil-price spike reigniting inflation fears — as Bloomberg reported — is precisely the macro narrative that keeps institutional risk appetite suppressed. If $BTC fails to reclaim the hourly EMAs and slips back below $64,000, the S1 at $63,224 comes quickly into focus, followed by the daily lower Bollinger Band at $61,069. This scenario falls apart if $BTC closes a daily candle above $65,000 with volume.
Positioning and Risk Context
What this market is asking traders to sit with is genuine uncertainty. The daily chart hands you a tentative recovery signal while the hourly hands you a short-term caution flag. Both can be true simultaneously — the daily trend trying to turn while the intraday structure is still unwinding. Ultimately, the Bitcoin price today sits precisely at the intersection of these conflicting timeframes. The compression in Bollinger Bands across multiple horizons strongly suggests a volatility expansion is coming. The honest answer is that the direction is not yet confirmed.
With the total crypto market cap near $2.28 trillion, per CoinGecko, and an ATR of $1,576 on the daily, any move that matters will be felt. The DEX ecosystem is showing mixed volume signals — Uniswap V3 fees spiked over 117% in a day while Uniswap V4 and Curve are declining. This suggests activity is rotating but not expanding broadly. That kind of fragmented on-chain engagement is consistent with a market that is cautious, not committed. Anyone navigating this environment should think in terms of defined risk, not directional conviction — because right now, the chart is building a case, but it has not closed it yet.
FAQ
What is Bitcoin’s current price level?
As of July 20, 2026, Bitcoin is trading at $64,290, caught in a tight range between daily bullish momentum and hourly selling pressure.
Is Bitcoin’s daily chart bullish or bearish right now?
The daily chart leans cautiously bullish. The MACD histogram is expanding positively at +267.79, and RSI is above 50 at 52.52. However, price remains well below the EMA200 at $74,405, keeping the broader trend structurally bearish.
What does Strategy’s Bitcoin accumulation mean for the market?
Strategy holds a $3 billion reserve raised via a stock sale and continues accumulating Bitcoin. This provides a significant institutional demand floor, though macro headwinds like inflation concerns have so far offset this tailwind.
What are the key levels to watch for Bitcoin?
On the upside, $BTC needs to reclaim the hourly EMA cluster near $64,400 and then target $65,231. On the downside, a loss of the daily EMA20 at $63,705 could open the path toward $63,224 and eventually $61,069.
Disclaimer: This article is for informational purposes only and does not constitute financial advice, an investment recommendation, or a solicitation to buy or sell any financial instrument or cryptocurrency. The analysis provided is not indicative of future results. Investing in crypto assets and financial markets carries a high risk of capital loss. Always do your own research (DYOR) and consult a qualified financial advisor before making any decision.
Article produced with the assistance of artificial intelligence and reviewed by the editorial team.