
Bitcoin price has slipped back toward $65,000 after spot ETF outflows, a major options expiry and rising oil prices stopped its rebound from extending beyond $66,800.
According to data from crypto.news, Bitcoin ($BTC) price traded near $65,050 on July 24, down about 2.6% from its July 21 peak. Traders remained cautious as the pullback brought the price closer to a large derivatives settlement level and a rising trendline that has supported the recovery since late June.
U.S. spot Bitcoin exchange-traded funds recorded $225 million in net outflows on July 23, according to SoSoValue data. BlackRock’s IBIT accounted for about $202 million of those withdrawals, reversing the steady institutional inflows that had helped Bitcoin recover from its June low near $58,000.
At the same time, U.S. technology shares suffered their sharpest sell-off since April 2025. The Magnificent Seven fell 4.8% on July 23 and lost about $797 billion in combined market value as investors questioned the scale of corporate spending on artificial intelligence. The Nasdaq 100 dropped 1.9%, while the S&P 500 lost 1.2%.
Bitcoin fell less than 1% during the equity sell-off, which showed relative strength against technology stocks. However, the decline in risk appetite denied $BTC the new capital needed to clear the $66,800 resistance area.
Oil prices added another obstacle. West Texas Intermediate crude eased to about $90.59 on Friday but remained on course for a weekly gain of nearly 10%, while Brent held near $98.87 after briefly trading above $100.
The United States carried out a 13th consecutive night of strikes on Iran as Washington and Tehran rejected immediate negotiations. President Donald Trump also threatened “major military punishment” against Iran and the Houthis after the militant group attacked two Saudi oil tankers in the Red Sea.

Higher energy costs could keep inflation elevated and reduce the Federal Reserve’s room to cut interest rates during the second half of 2026. Rising Treasury yields would also increase the appeal of income-producing assets over Bitcoin, which pays no interest.
Bitcoin price remains above its rising trendline despite weaker momentum
Bitcoin’s 4-hour chart shows an ascending support line connecting a series of higher lows formed since the price bottomed near $58,000 in late June. The trendline now sits between $63,700 and $64,300, placing the current price about 1.5% above the structure.
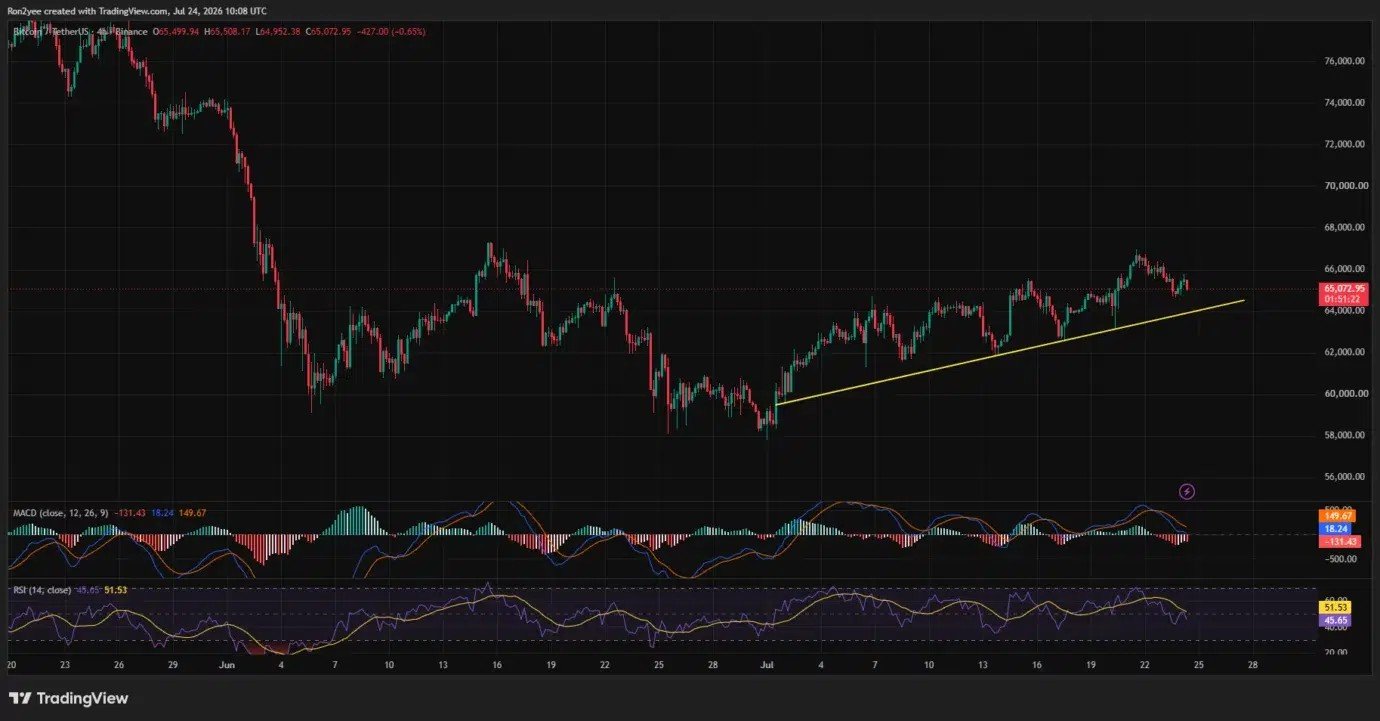
Momentum has weakened after $BTC failed to hold above $66,000. The 4-hour Relative Strength Index fell to 45.65, below its signal average of 51.53, but remained above the oversold threshold of 30.
Meanwhile, the Moving Average Convergence Divergence line dropped below its signal line. The histogram reached negative 131, which shows that sellers have controlled the latest 4-hour candles following the rejection near $66,800.
On the daily chart, Bitcoin remains above its 20-day and 50-day simple moving averages at $64,293 and $63,181. The price must hold those levels to preserve the recovery structure formed since June.
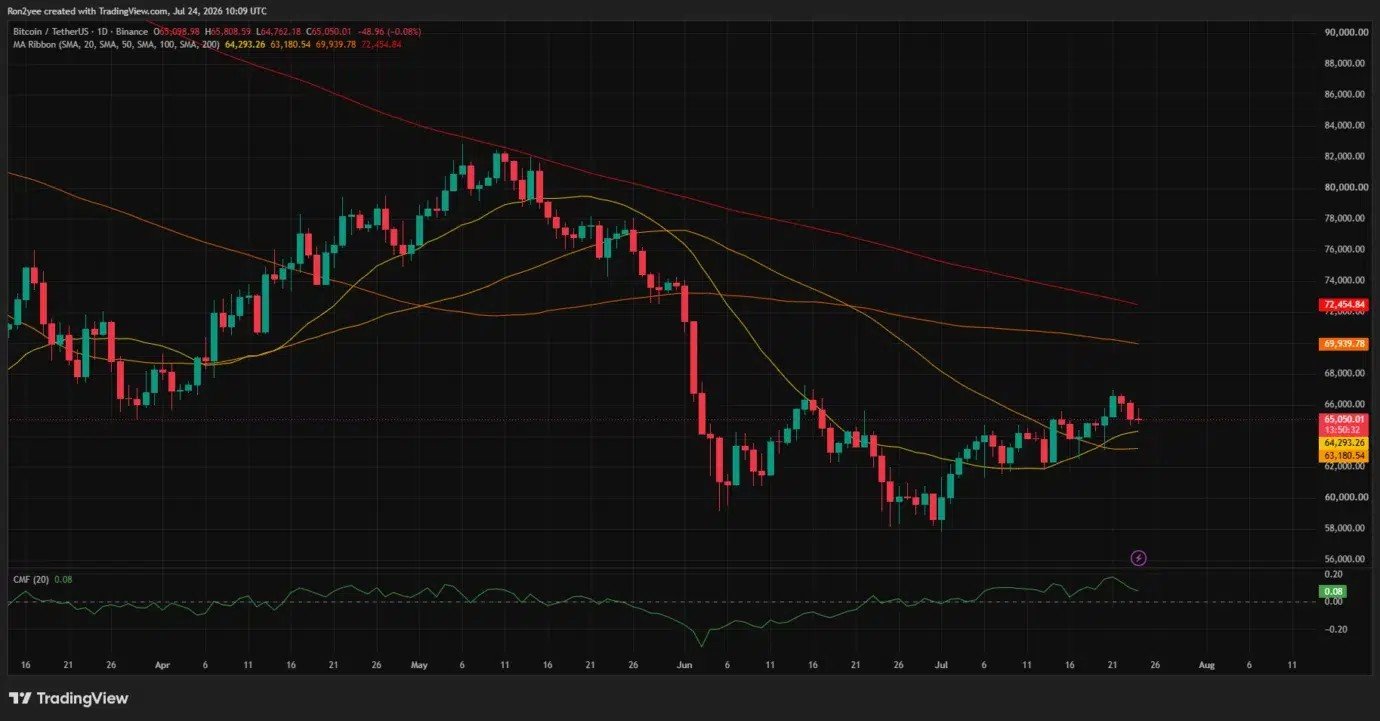
Chaikin Money Flow remained positive at 0.08, showing that buying volume has not fully left the market despite the ETF withdrawals. However, $BTC still trades below its 100-day and 200-day moving averages at $69,940 and $72,455, leaving the long-term trend under seller control.
A daily close above $66,800 would open the path toward the 100-day average near $70,000. Bitcoin would then need to reclaim $72,455 to establish a stronger trend reversal.
The one-week CoinGlass liquidation heatmap places the nearest large pool of leveraged positions around $64,200–$64,500. Another dense cluster sits near $63,500, while upside liquidity has accumulated around $65,700 and between $66,500 and $67,300.
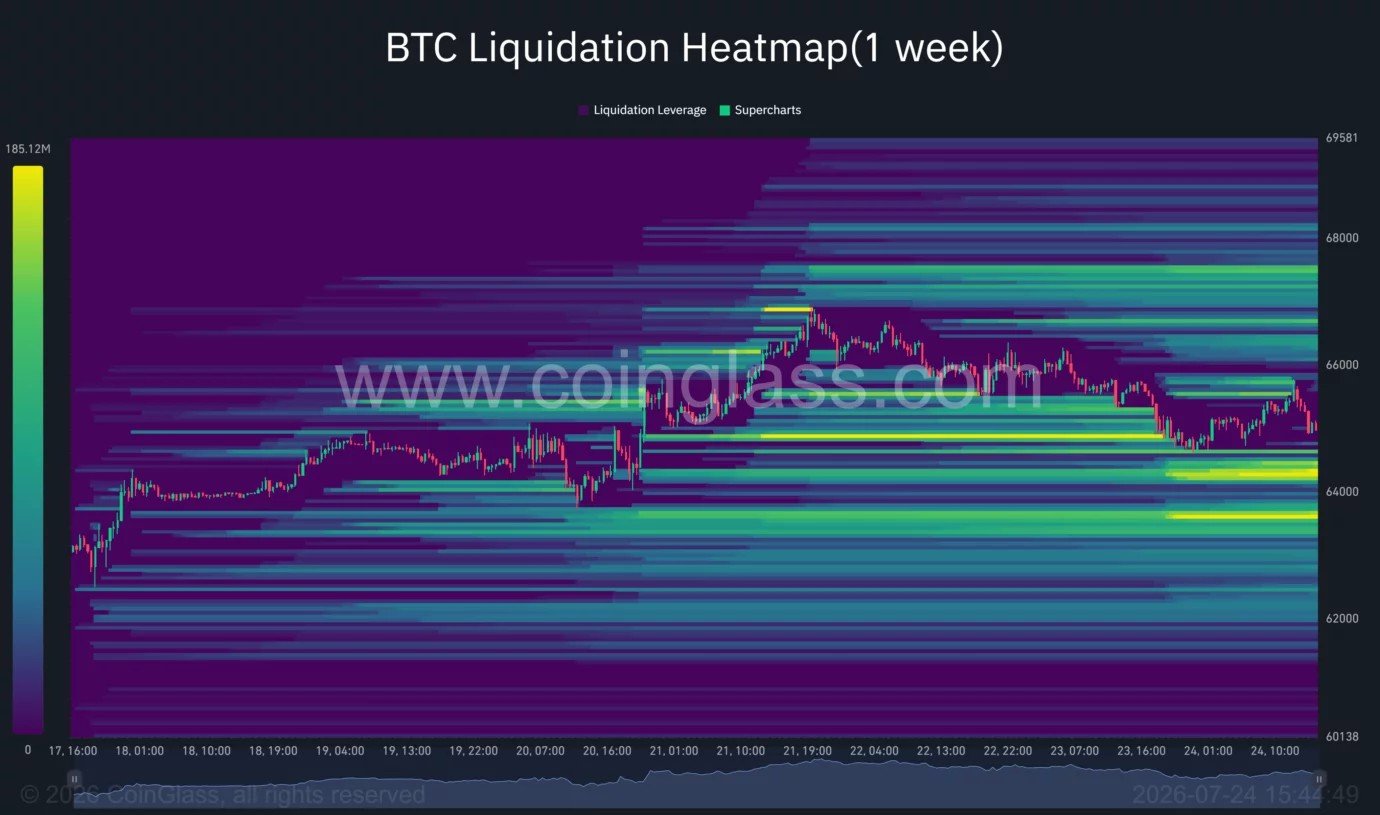
Those levels could attract price as traders approach the weekly derivatives settlement. About 19,000 Bitcoin options worth $1.2 billion expire on July 24, with a put-call ratio of 0.89 and maximum pain at $64,500, according to Greeks.live data. Implied volatility has also fallen toward 35%, while gamma exposure is concentrated at $65,000 and $72,000.
Drop under $63,700 would invalidate the local recovery
According to crypto analyst Lennaert Snyder, Bitcoin’s long setup remains active after $BTC swept the $65,000 lows. Snyder identified $64,600 as a possible second-entry area and $67,000 as the next liquidity target.
“The invalidation for the local long thesis is the 63.7K low,” Snyder wrote.
$BTC is respecting our long-POI very well.
— Lennaert Snyder (@LennaertSnyder) July 24, 2026
Like I posted yesterday, the long after the sweep of the 65K lows is active.
I took 25% profits and stoploss to BE, the zone is still valid for 2nd taps.
So if we sweep the current 64.6K low, I'll look for another confirmation entry… pic.twitter.com/Df5fTt878u
A 4-hour close beneath $63,700 would break the rising trendline and expose the liquidation cluster near $63,500. Continued selling could then push $BTC toward $62,000, followed by the June support zone between $58,000 and $60,000.
On the upside, $67,000 and $68,100 remain the immediate resistance levels. Snyder views $68,100 as both a profit-taking zone for long positions and a possible short entry, with $60,000 as the bearish target after a liquidity sweep.
Bitcoin’s outlook therefore depends on whether buyers defend the $63,700–$64,500 area after the options expiry. A renewed oil surge, further ETF withdrawals or an escalation in the U.S.-Iran conflict would raise the risk of a trendline breakdown, while a close above $66,800 would return control to buyers.