
Bitcoin trades at $65,246 on July 24, up 0.30%, holding above the ascending trendline from the June low despite a sharp ETF outflow day and oil pushing toward $95 on renewed Iran tensions. The Sharpe ratio has compressed to -23, a reading that appeared at the 2015, 2019, and 2022 bear market bottoms before each of Bitcoin’s three major recovery cycles.
$BTC Is Riding An Ascending Trendline Into Horizontal Resistance
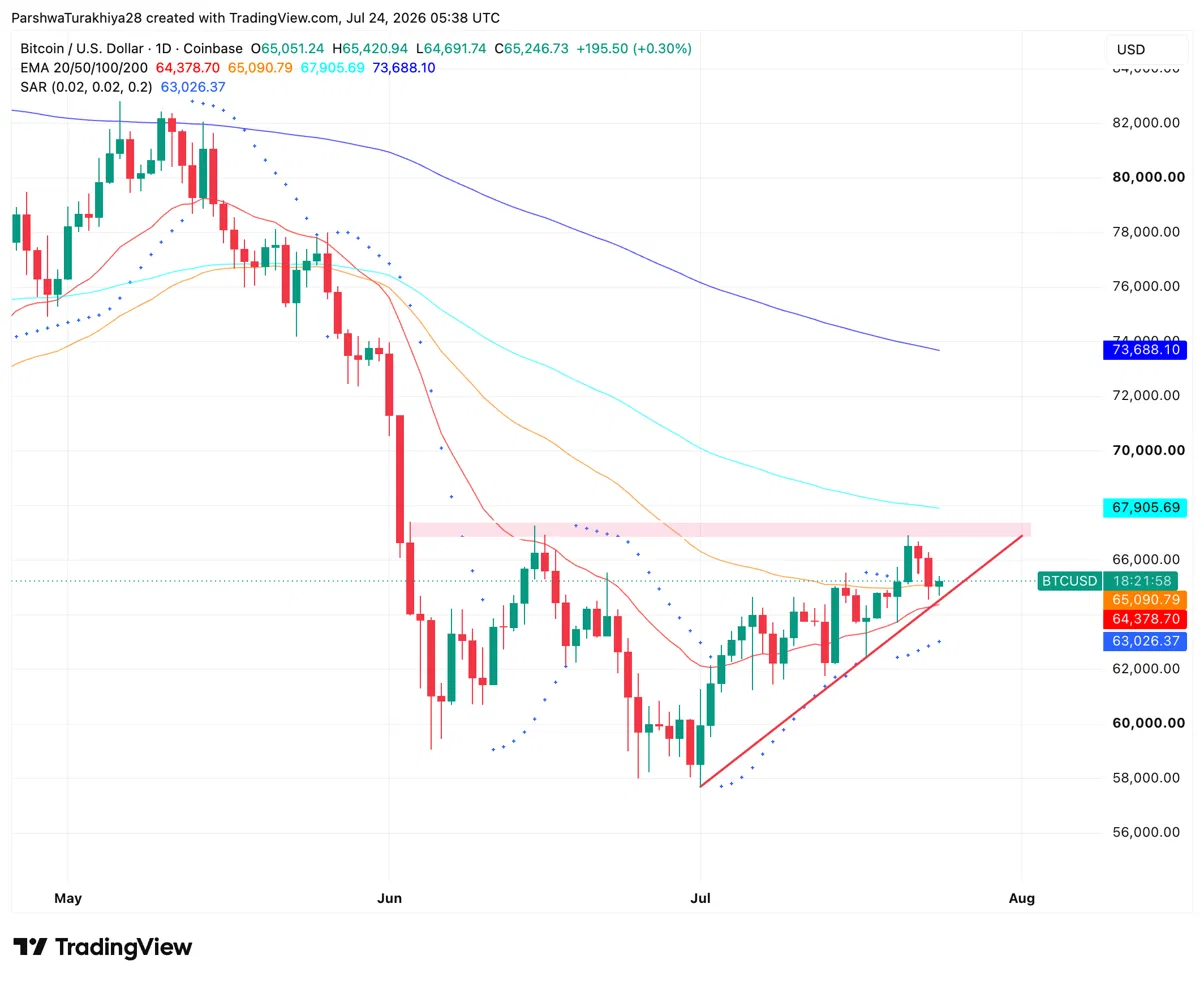
The daily chart shows $BTC supported by an ascending trendline from the late June low near $57,500, with price consolidating between that trendline and a horizontal resistance band visible near $66,000 to $67,000. The Parabolic SAR at $63,026 remains bullish below price. The 20-day EMA at $64,378 and 50-day at $65,090 have converged into a tight support cluster just below current price, and both have been reclaimed after the June breakdown.
A golden cross between the 20-day and 50-day EMAs is forming on the chart, a signal that has historically preceded sustained price surges when accompanied by accumulation. The 100-day EMA at $67,905 is the next ceiling above the horizontal resistance band, followed by the 200-day at $73,688. Short-term holders have seen losses narrow from the June lows to approximately -4% against their $68,800 cost basis, a level where holders historically begin to retain rather than sell, tightening available supply.
What Are The Key Support And Resistance Levels For $BTC Today?
A $225M Outflow Snapped A Seven-Day ETF Inflow Streak
Spot Bitcoin ETFs recorded $225.18M in net outflows on July 23 according to SoSoValue, ending seven consecutive days of positive inflows that had totaled over $930M. BlackRock’s IBIT drove most of the exit at $202.48M, with Fidelity’s FBTC adding $5.64M in outflows and Bitwise contributing $7.03M.
Morgan Stanley’s MSBT was the only fund to record inflows on the session at $5.01M. Total net assets slipped to $78.82B from $80.36B the prior day. The one-day reversal follows a pattern seen throughout July where institutional demand steps in on dips rather than sustaining continuous accumulation, making a single outflow day less meaningful than a multi-day trend.
The Sharpe Ratio Signal That Called Three Previous Bottoms
OPTIMAL TIME TO ACCUMULATE BITCOIN
— Ali Charts (@alicharts) July 23, 2026
Bitcoin's Sharpe ratio has dropped to -23, signaling an optimal window for spot accumulation.
The Sharpe ratio measures the reward per unit of risk, or volatility. A positive ratio indicates returns outweigh risk, while a negative ratio… https://t.co/SxJ0w635qE pic.twitter.com/PVHEAmIDS0
Ali Charts flagged Bitcoin’s Sharpe ratio compressing to -23, describing it as a signal of deep seller exhaustion rather than endless downside. The Sharpe ratio measures reward per unit of risk, and a reading this negative indicates investors have experienced severe drawdowns relative to returns.
The same compression appeared at the 2015 bear market bottom near $235, the 2019 bottom near $3,333, and the 2022 bottom near $16,270, each of which preceded major recovery cycles of 8,300%, 1,911%, and 675% respectively. Ali Charts described current levels as an asymmetric risk-to-reward entry point for long-term spot buyers.
Meanwhile, analyst Michaël van de Poppe separately noted $BTC’s resilience at $65,000 with oil at $95 as evidence that market strength is not dependent on a calm macro environment.
Bitcoin Derivatives: What Smart Money Is Doing Right Now
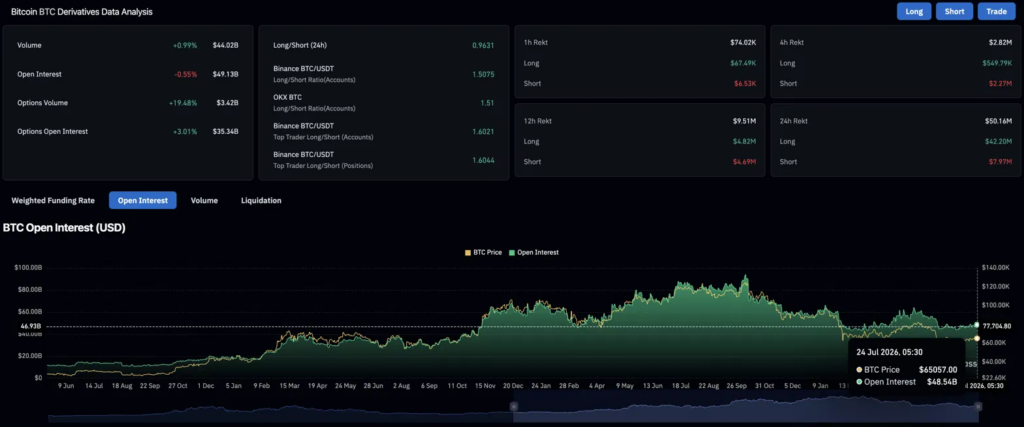
Volume rose 0.99% to $44.02B while open interest fell 0.55% to $49.13B, pointing to position closures rather than fresh directional bets on the session. Options volume jumped 19.48% to $3.42B with options open interest up 3.01% to $35.34B, suggesting traders are hedging around the $65,000 to $67,000 resistance band rather than committing outright to a breakout bet.
Long liquidations over 24 hours hit $42.20M against $7.97M for shorts, a ratio that leans toward flushing overleveraged buyers rather than signaling a genuine trend shift. Top traders on Binance hold a 1.60 long/short ratio on accounts and 1.60 on positions, both firmly net long. The retail long/short ratio at 0.9631 is near balanced, showing smaller traders are not yet chasing the move heading into the weekend and the July 29 FOMC meeting.
Bitcoin Price Prediction: Upside and Downside Targets
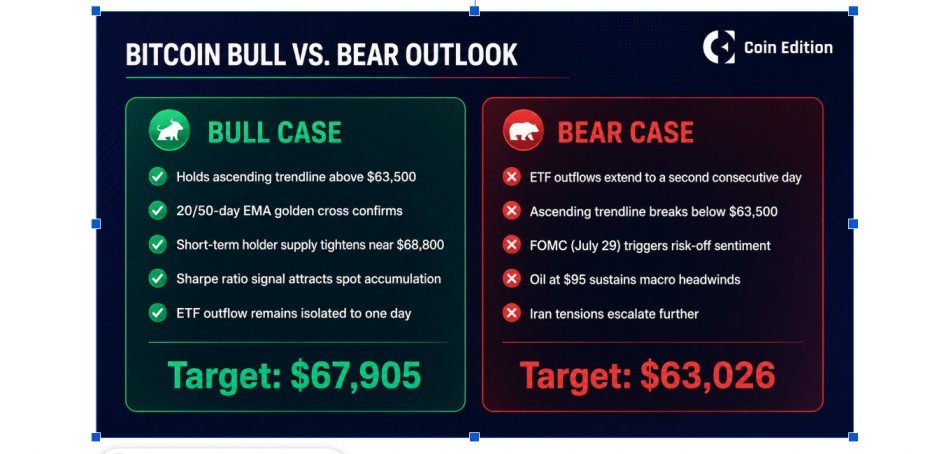
- Upside case: $BTC holds the ascending trendline and the 20-day EMA cluster at $64,378, the golden cross confirms, short-term holder supply tightens near the $68,800 cost basis, and price clears the horizontal resistance band toward the 100-day EMA at $67,905 as the Sharpe ratio signal attracts spot accumulation.
- Downside case: The ETF outflow extends into a second consecutive day, the ascending trendline breaks below $63,500, and $BTC retests the Parabolic SAR at $63,026 as oil at $95 and Iran tensions keep risk appetite suppressed heading into the July 29 FOMC meeting.