
Bitcoin’s bear market may be close to its final stage, but the charts still leave room for a drop toward $25,000-$35,000. A durable bottom there could set up the next major rally, with the long-term cycle model pointing toward a possible peak in 2029.
Bitcoin Elliott Wave Map Points to a 2029 Bull Market Peak
Bitcoin could face a deeper correction before beginning another multi-year expansion, according to an Elliott Wave roadmap from More Crypto Online. The chart places the next major cycle top in late 2029, followed by a prolonged bear market through 2030.
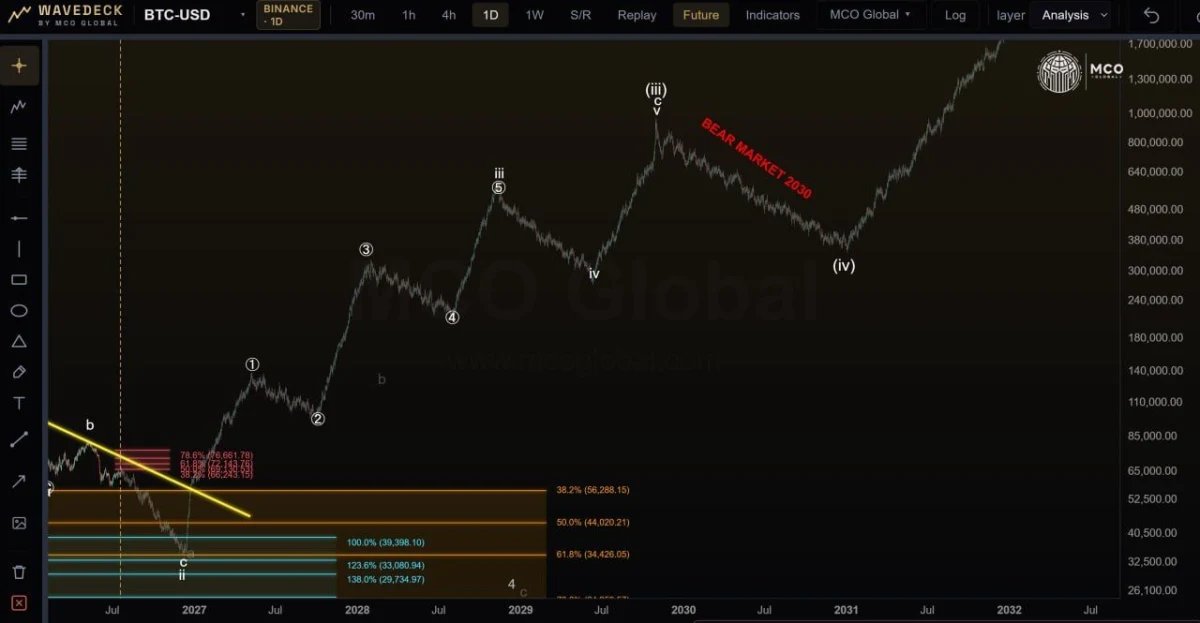
$BTC daily chart. Source: More Crypto Online/X
The near-term structure remains corrective, with the chart highlighting several possible downside levels. Initial support sits near $56,300, followed by $44,000 and $39,400. A deeper decline could extend toward the $29,700-$34,400 region before the broader bullish sequence begins.
From that base, the projected five-wave advance targets progressively higher levels. The first major expansion could carry Bitcoin above $100,000, followed by later waves toward $300,000 and beyond. However, these distant targets depend heavily on the Elliott Wave count remaining valid over several years.
The model places the larger third-wave peak around late 2029, potentially near the high-six-figure range. It then projects a major correction through 2030 before another final advance toward seven figures during 2031-2032.
This remains a long-term scenario rather than a confirmed forecast. Bitcoin must first complete the current correction, form a durable bottom and begin producing higher long-term highs before the 2029 peak projection gains stronger support.
Bitcoin Bear Market May Be Entering Its Final Stage
Bitcoin remains under pressure, but the chart suggests the broader bear market could be approaching its final phase. One more decline toward long-term support may come before $BTC begins a larger recovery into 2027.
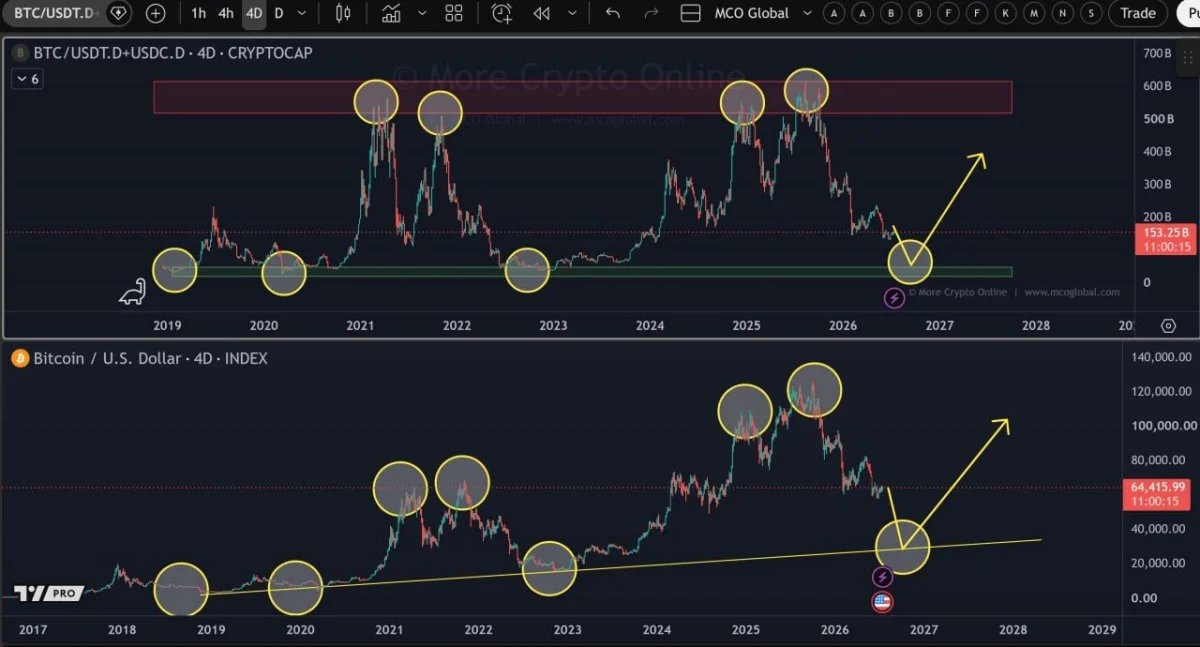
$BTC four-day chart. Source: More Crypto Online/X
The lower chart compares the current structure with major lows formed in 2018, 2020 and 2022. Each earlier bottom developed near long-term rising support before Bitcoin began another major expansion.
The projected path shows $BTC falling toward roughly $25,000-$35,000 later in 2026. A strong reaction from that region could complete the bearish cycle and prepare the market for a recovery toward $100,000 or higher.
The upper chart shows a related Bitcoin and stablecoin-dominance measure approaching a support area that previously appeared near market bottoms. Both panels therefore suggest the decline may be advanced, although neither confirms that the final low is already in place.
The outlook would weaken if Bitcoin loses long-term support and fails to recover. Until a durable bottom and higher highs appear, the chart remains a possible cycle roadmap rather than a confirmed reversal.