
Bitcoin trades at $65,457 on July 27, up 0.18%, catching a bid after Iran signaled a willingness to pause hostilities while pressing against the bear market resistance band that has capped every rally attempt since February.
$BTC Is Compressing Between The Bear Market Resistance Band And Its EMA Cluster
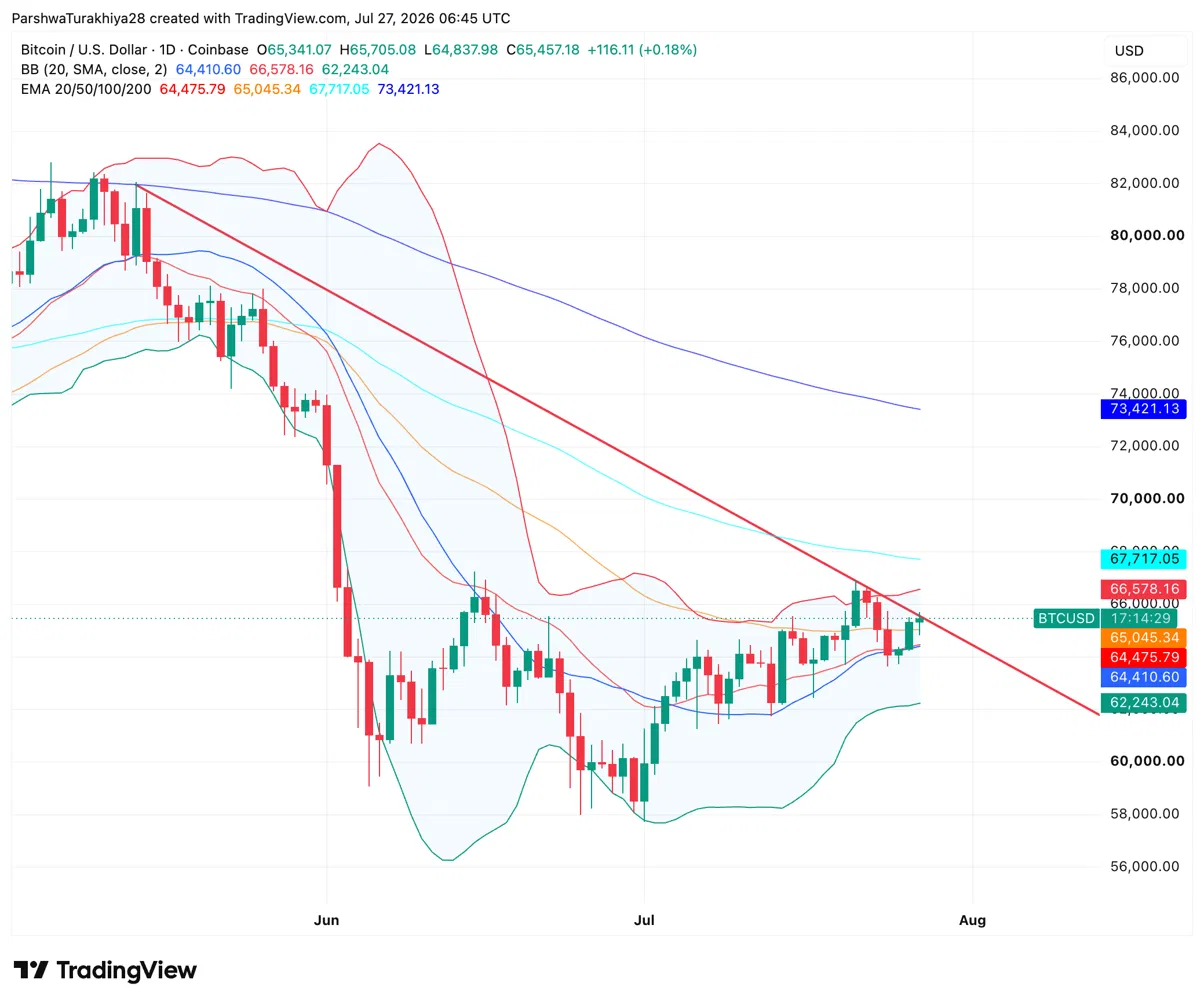
The daily chart shows $BTC consolidating between the 20-day EMA at $64,475 and the Bollinger upper band at $66,578, with a descending red trendline from May’s peak sloping down through that same zone. That trendline is Benjamin Cowen’s bear market resistance band, and it has rejected price on every approach since February. The 50-day EMA at $65,045 sits almost exactly at current price, making the EMA cluster the immediate support test.
Related: Cardano Price Prediction: Can ADA Break $0.20 as Ark Invest and Hoskinson Clash Over Its Relevance?
The Bollinger midline at $64,410 and the 20-day EMA at $64,475 form a tight support zone just below. A close above the Bollinger upper band at $66,578 and the descending trendline would be the first genuine breakout signal of the recovery. Above that, the 100-day EMA at $67,717 is the next target, with the 200-day at $73,421 as the longer-term ceiling. The lower Bollinger Band at $62,243 defines the floor below if support gives way.
What Are The Key Support And Resistance Levels For $BTC Today?
- Support at $65,045 on the 50-day EMA and $64,475 on the 20-day EMA
- Resistance at $66,578 on the Bollinger upper band and the descending bear market resistance band
- Extended resistance at $67,717 on the 100-day EMA
- Key floor at $62,243 on the lower Bollinger Band
Iran’s Ceasefire Signal Could Be The Macro Unlock Markets Needed
Analyst Michaël van de Poppe flagged on July 26 that Iran has signaled it will pause its attacks provided the United States halts military operations.
Van de Poppe described it as a great sign for Bitcoin and crypto markets and called for a green week ahead. Geopolitical tension has been one of the consistent headwinds for risk assets since June, with oil price spikes and Strait of Hormuz uncertainty repeatedly unsettling sentiment at key technical levels.
Benjamin Cowen Sees A 2018 Replay With August Losses Ahead
Cowen’s latest video maps Bitcoin’s 2026 structure against 2018 point by point: the February low, the higher low in late March, the sweep of June lows in early July, and the current rally back toward the bear market resistance band.
In 2018, that rally ran through late July and then gave everything back in August and September. His base case is the same outcome here, with a Q4 breakdown forming the market cycle bottom where on-chain indicators historically reset. His pivot condition has not changed: if $BTC has not broken down by year-end, he calls the bull market back on.
Anthony Scaramucci Says $10 Trillion Is The Next Stop For Bitcoin
Appearing on The Wolf of All Streets podcast, Scaramucci noted Bitcoin’s $1.2 trillion market cap is roughly the size of Micron Technology, and argued a $10 trillion valuation would still not register against global capital markets. He used gold’s $28 trillion market cap as the benchmark, calling Bitcoin more scarce, more portable, and easier to move than the metal it is increasingly competing with. He described the current environment as apathy rather than structural failure, drawing a parallel to Uber, where technology that genuinely serves people eventually wins regardless of who tries to block it.
Related: Espresso Price Prediction: Bullish Momentum Builds as ESP Targets $0.1208 After 42% Weekly Rally
On the CLARITY Act, Scaramucci said plainly he does not think it passes, not from pessimism but from how Washington actually works. He argued Democrats have every incentive to block it simply to deny Trump a win, regardless of the bill’s merits. He credited SEC Chair Paul Atkins as a steady hand but warned that without legislation, crypto regulation stays a pendulum that swings with whoever holds power.
Bitcoin Price Prediction: Upside and Downside Targets
- Upside case: Iran’s ceasefire signal holds, $BTC closes above the Bollinger upper band at $66,578 and the bear market resistance band, FOMC confirms a rate hold on July 29, and van de Poppe’s green week call plays out toward the 100-day EMA at $67,717 as geopolitical risk premium unwinds.
- Downside case: Cowen’s 2018 analog plays out on schedule, $BTC gets rejected at the bear market resistance band, the 50-day EMA at $65,045 fails as support, and price slides toward the Bollinger midline at $64,410 and the 20-day EMA at $64,475 as August seasonal weakness sets in.