
Bitcoin is trading near $77,000 on Wednesday as sellers push $BTC back toward a support zone that could determine whether the August recovery survives. Short-term price structure points to a possible bounce if $76,000-$77,000 holds, but the weekly chart shows bulls still face a larger hurdle near the 50-week moving average before a durable trend reversal can be confirmed.
Bitcoin Returns to the $76K-$77K Decision Zone
Bitcoin has returned to the lower boundary of a tightening descending structure after repeatedly failing to break through the upper trendline. The three-hour chart places the immediate decision area around $76,000-$77,000, with $BTC trading near $76,789 when the chart was captured.
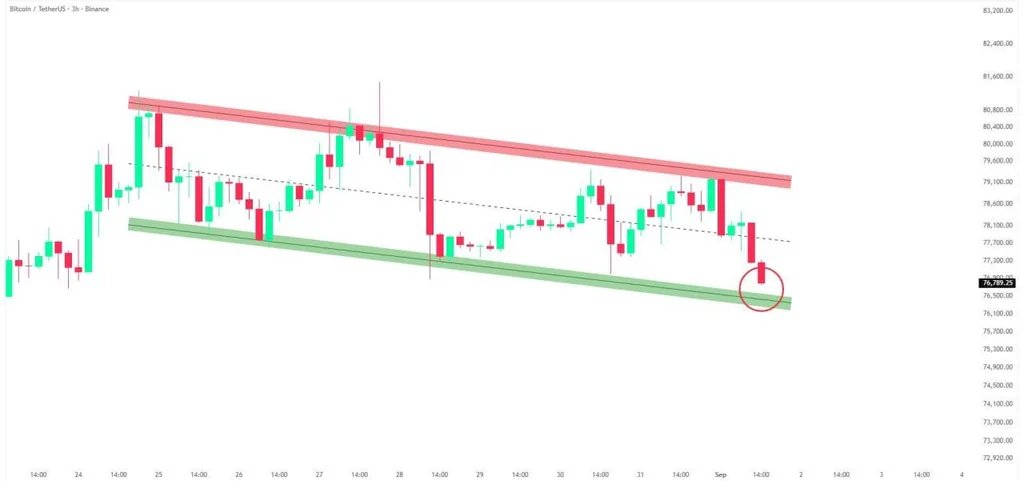
Bitcoin $BTC $76K-$77K Support Test. Source: Wealthmanager on X
That zone has become increasingly important because price is testing the lower edge of the descending channel after several days of compression. A successful defense would keep the structure intact and could trigger a rebound toward roughly $78,000, followed by the upper resistance area around $79,000-$80,000.
Wealthmanager described the area as a major decision point, arguing that a hold could produce a sharp bounce while a loss of support would expose Bitcoin to a more damaging breakdown.
The bearish confirmation would be a sustained move below the lower channel rather than a brief intraday wick. If $76,000 fails to hold, the chart offers less nearby structural support, increasing the risk that sellers push $BTC toward lower price zones.
Live market data showed Bitcoin around $77,300-$77,400 early Wednesday, underscoring how closely price remains tied to this support test.
Bitcoin’s 50-Week Average Remains the Bigger Bullish Test
The weekly chart presents a more cautious picture. Bitcoin's rebound from roughly $62,000 carried price toward $80,000, but $BTC remains below the declining 50-week weighted moving average, which sits just above the current market around the low-$80,000 region on the supplied chart.
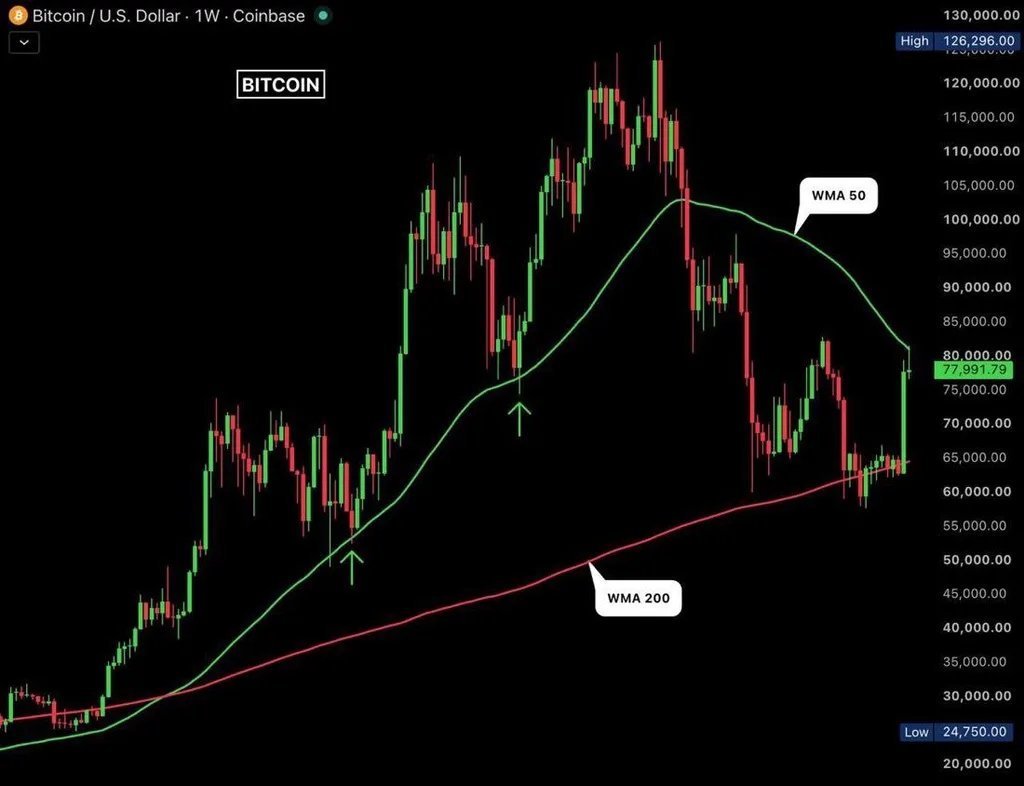
Bitcoin $BTC 50-Week WMA Resistance. Source: MrTranquility on X
MrTranquility argues that the rally should be treated as a bear-market recovery unless Bitcoin can reclaim that moving average. His base case calls for a lower low during the fourth quarter, although that remains a forecast rather than a confirmed outcome.
The technical distinction matters. Holding $76,000-$77,000 could produce another short-term rally, but a move toward $80,000 alone would not necessarily confirm a broader bullish reversal. Bulls would need to break above the 50-week average and then hold it as support to strengthen the argument that the larger downtrend is changing.
The weekly chart also shows the 200-week weighted moving average rising near the low-$60,000 region, where $BTC recently found support. A return toward that area would become more relevant only if the current recovery structure deteriorates substantially.
Rising Yields Add Pressure to Bitcoin’s Support Test
Bitcoin's technical decision comes against a difficult macro backdrop. U.S. 10-year Treasury yields climbed to about 4.81% Wednesday as renewed U.S.-Iran tensions pushed oil prices higher and strengthened the dollar, creating another headwind for risk assets. Brent crude rose above $95 a barrel, while global equity markets declined.
Bitcoin had already struggled around $78,000 Tuesday as traders increased expectations for another Federal Reserve rate increase. CoinDesk reported that the cryptocurrency had traded between roughly $77,200 and $79,200, while the $82,000 area had repeatedly rejected recent advances.
For the near-term Bitcoin price prediction, $76,000-$77,000 is the level that matters most. Holding that support could reopen $79,000-$80,000 and eventually the 50-week average, but a confirmed breakdown would shift momentum back toward sellers and strengthen the case for a deeper correction.