
Bitcoin is holding near $79,000 as two technical setups point to a potentially important stretch for $BTC, with bulls watching an $82,800 breakout while a deeper retest near $68,000 remains possible within the broader uptrend. A coming golden cross and improving weekly momentum support the bullish case, but confirmation depends on Bitcoin clearing overhead resistance and defending key support if volatility returns.
Bitcoin Weekly Structure Keeps $68,000 Retest in Focus
Bitcoin’s weekly chart remains constructive despite the possibility of a deeper pullback, with analyst Jesse Olson comparing the current setup with Bitcoin’s 2023 bull-market structure.
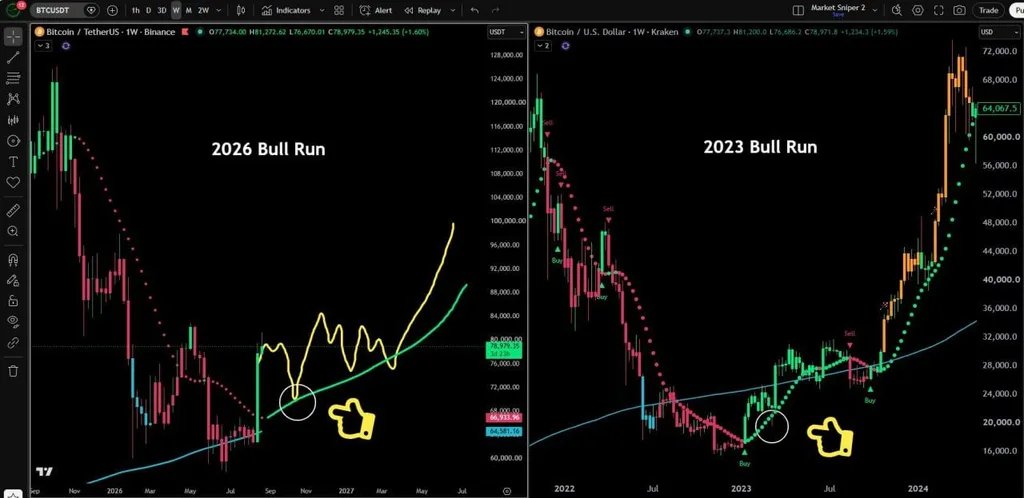
Bitcoin $BTC Weekly Trend Dot Retest. Source: Jesse Olson (@JesseOlson) on X.
The comparison centers on a weekly trend indicator that begins printing green dots as momentum improves. Olson notes that during the 2023 advance, Bitcoin eventually returned to retest the eighth green trend dot near $19,500 before resuming its broader move higher.
A similar setup could now place the rising weekly trend area near $68,000 by October. That would represent a sizable decline from current levels, but the chart treats such a move as a potential support retest rather than confirmation of a bearish reversal.
The bullish interpretation would remain intact if Bitcoin pulls back toward the rising trend dots, finds demand and forms another higher low. A strong reaction from that region could keep the longer-term structure pointed higher and open the door to another attempt toward the upper-$80,000s and potentially the psychological $100,000 area shown in the chart projection.
The scenario would weaken if $BTC loses the rising weekly trend structure decisively. In that case, the historical comparison with 2023 would become less reliable and the market would need to establish a new support base.
Bitcoin Needs $82,800 Breakout as Golden Cross Nears
Bitcoin’s shorter-term chart presents a more immediate bullish test, with Super฿ro highlighting $82,814 as the key swing-high resistance while a projected golden cross approaches in early September.
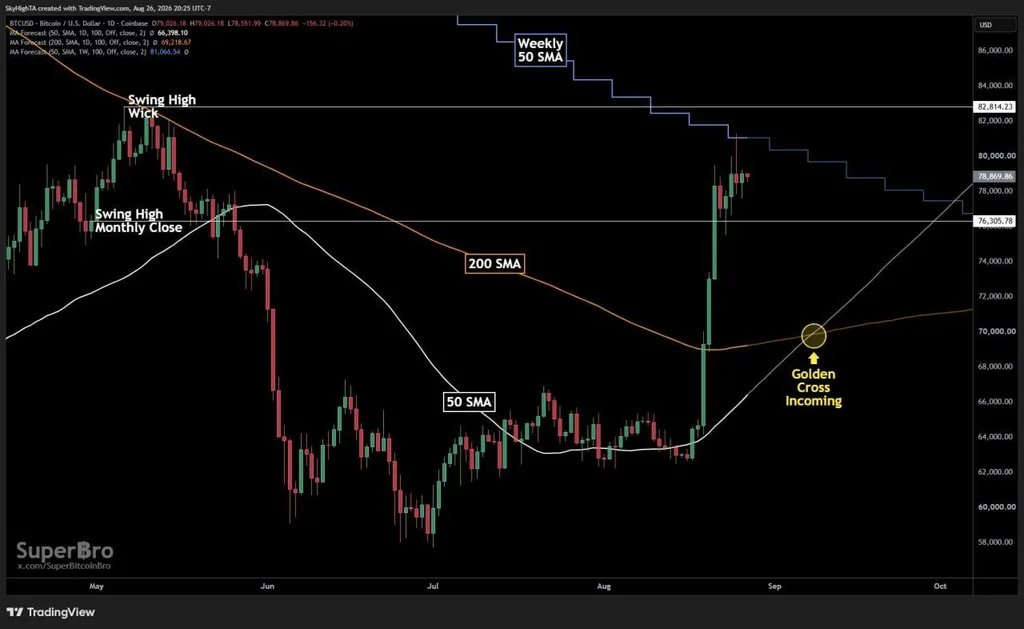
Bitcoin $BTC $82.8K Breakout and Golden Cross. Source: Super฿ro (@SuperBitcoinBro) on X.
$BTC is shown near $78,870 and above the previous swing-high monthly close at roughly $76,306. Holding above that level is constructive because it suggests Bitcoin has reclaimed an important closing-basis resistance zone.
The next major hurdle sits around $82,800. A decisive break above that swing high would establish a higher high and strengthen the argument that the rebound from the mid-$60,000 area has developed into a broader bullish continuation.
Bitcoin is also approaching the descending weekly 50-period SMA shown above price. Reclaiming that moving average alongside a break above $82,800 would provide stronger confirmation that buyers are overcoming the remaining overhead resistance.
The chart additionally projects a golden cross between the rising 50-day and 200-day simple moving averages around Sept. 8. Although the signal is generally associated with improving medium-term momentum, it is lagging and would need support from price action to carry greater significance.
For now, $76,300 is the first important downside level. Holding above it keeps the immediate structure constructive, while a break below would raise the risk of a larger retracement. Taken together, the two charts suggest Bitcoin could first challenge $82,800, but even a later drop toward $68,000 would not necessarily invalidate the broader bullish trend if that area holds as support.