
The $BTC price prediction stays cautious as price grinds inside a well worn range, still capped by a descending trendline that has guided every rally lower since May. ETF flows and derivatives data both flashed mixed signals this week, with a fresh Monday inflow offsetting last week’s steepest outflow in over a month.
Bitcoin Price Analysis: Trendline Still Overhead as Price Holds the Range
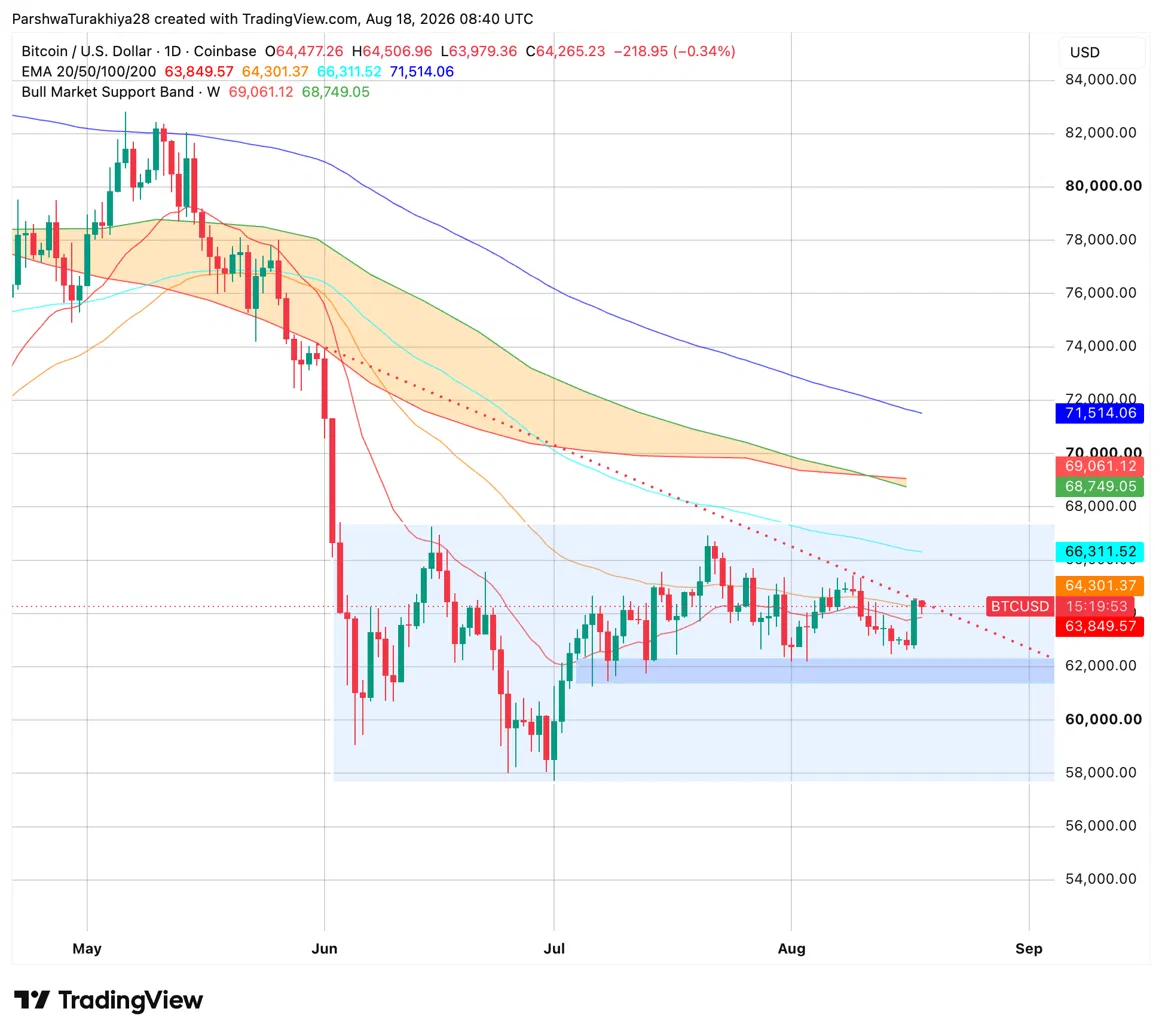
$BTC has traded inside a broad range between roughly $58,000 and $68,700 since early June, with price now sitting just below the descending trendline drawn from May’s high. That trendline currently tracks close to the 20-day EMA at $63,849.57, so price is testing both levels at the same time. Clearing them would be the first real sign the downtrend pressure is easing.
The EMA stack above still looks stretched. The 50-day sits at $64,301.37, just overhead, followed by the 100-day at $66,311.52 and the 200-day much further out at $71,514.06. On the weekly chart, the Bull Market Support Band sits well above price between $68,749.05 and $69,061.12, a zone that has acted as major support in past bull cycles but is out of reach for now.
Related: Solana Price Prediction Eyes $83 As Solana Tops Every Chain In RWA Inflows
Below current price, a tighter support zone near $61,500 to $62,500 has held on repeated tests, with the $58,000 floor from June marking the range’s lower edge.
$BTC Support and Resistance Levels, August 18, 2026
Bitcoin News: ETF Inflows Return Monday After Worst Week Since Early July
Bitcoin spot ETFs took in $137.32M on Monday, August 17, according to SoSoValue data, led by Fidelity’s FBTC with $111.90M and Ark and 21Shares’ ARKB adding $14.18M. The move follows a rough stretch for the group, with the week ending August 14 posting $389.71M in net outflows, the steepest weekly pullback since the week of July 2, which saw $526.64M leave the funds.
The prior week, ending August 7, had actually been strong, pulling in $853.54M, so the swing between weeks shows flows are still choppy rather than trending firmly in one direction. Cumulative net inflow across all Bitcoin ETFs now stands at $51.93B, with total assets held across the group at $76.61B as of the most recent weekly data.
Bitcoin News: Supply in Loss Edges Above Supply in Profit
Bitcoin supply in profit vs loss tells us the cycle bottom is imminent pic.twitter.com/Cfao9UZIy4
— Quinten (@QuintenFrancois) August 18, 2026
On-chain analyst Quinten Francois flagged on August 18 that Bitcoin’s supply in loss, the share of circulating $BTC currently worth less than what its holder paid, has climbed to 51.7%, edging above the 48.3% of supply currently sitting in profit.
Francois pointed to this same crossover preceding past cycle bottoms, referencing similar setups in January 2015, December 2018, March 2020, and November 2022, each followed by major recoveries ranging from 304% to over 11,000%.
Related: PI Price Prediction Holds Steady At $0.086 As Pi Network Overhauls App Economy
The pattern isn’t a guaranteed signal, and past performance doesn’t confirm the current cycle will follow the same path, but it adds real context to why some analysts read the current drawdown as closer to exhaustion than continuation.
Bitcoin Derivatives: Volume Jumps 68% as Shorts Take the Liquidation Hit
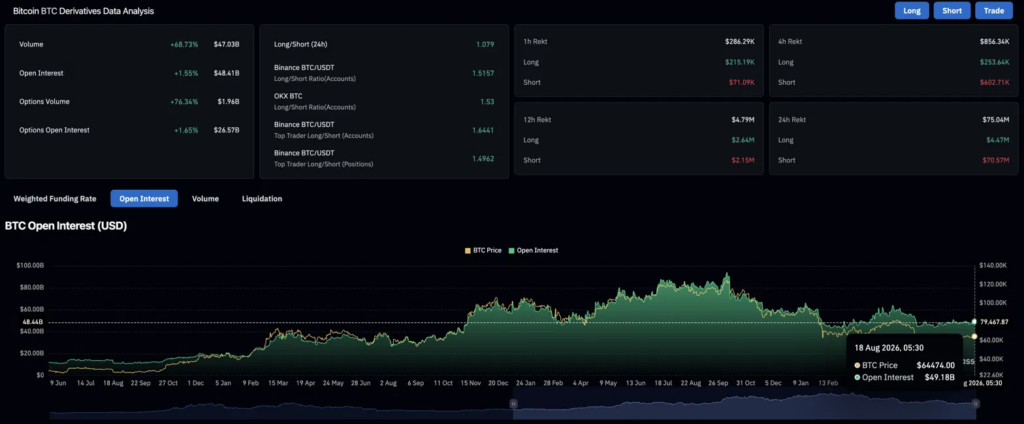
Bitcoin’s derivatives volume jumped 68.73% to $47.03B over the past 24 hours, showing a lot more leveraged trading activity. Open interest, the total money locked into open positions, rose a smaller 1.55% to $48.41B, meaning trades turned over fast rather than piling up. Options volume, bets on specific price levels, jumped even harder, up 76.34% to $1.96B.
Traders are leaning bullish too. Binance shows 1.52 long positions for every short, and OKX shows a similar 1.53 ratio, meaning more money is betting on Bitcoin rising than falling.
That bullish lean shows up in liquidations, when leveraged bets get force closed after price moves against them. Of the $75.04M liquidated in the past 24 hours, $70.57M came from short sellers caught out as price ticked up, while longs lost just $4.47M. That pressure faded fast though. In the most recent hour, longs took the bigger hit at $215.19K against $71.09K in shorts, showing the squeeze has already cooled off.
$BTC Price Prediction: Upside and Downside Targets
Bullish Case, Target: $66,311.52 (100-day EMA)
$BTC clears the descending trendline and the 50-day EMA at $64,301.37 on a daily close, confirming buyers are back in control of the short term trend. Monday’s ETF inflow builds into a multi-day streak, reversing last week’s outflow pressure, and the elevated long to short ratios translate into sustained upward pressure rather than another short squeeze that fades. A confirmed breakout opens the path toward the 100-day EMA at $66,311.52.
Bearish Case, Risk Level: $58,000 (June Range Floor)
The trendline and 50-day EMA continue to cap every bounce, and $BTC loses the $61,500 to $62,500 support zone on a daily close. ETF flows revert to outflows after Monday’s brief reprieve, and the heavy long positioning across exchanges becomes a liability if price turns lower, setting up further long liquidations rather than the short squeeze seen over the past 24 hours. Price falls back toward the $58,000 range floor that has held since June.
Related: Venice Token Price Prediction: VVV Eyes $15 as Revenue Surges Past $100 Million
Conclusion
Bitcoin’s setup right now has more moving parts than a typical range test, and they don’t all point the same way. ETF flows are choppy rather than trending, derivatives positioning leans bullish while liquidations show that lean already fading within the hour, and the supply-in-loss crossover offers a historically meaningful signal that still comes with no guarantee attached.
The trendline and 20-day EMA converging at the same price is the cleanest single test in this whole picture: a daily close above both would be the first unambiguous signal buyers have reclaimed control, while losing the $61,500 to $62,500 zone below would put the $58,000 June floor back in play.
FAQs Related to Bitcoin Price Prediction
What is the Bitcoin price prediction right now?$BTC trades at $64,265.23 while testing both a descending trendline and its 20-day EMA at the same time. The bullish target is $66,311.52 at the 100-day EMA, while the bearish risk level is $58,000 at the June range floor if support breaks.
Why did Bitcoin ETF inflows return on Monday?Fidelity’s FBTC led the rebound with $111.90 million, followed by Ark and 21Shares’ ARKB at $14.18 million, together bringing $137.32 million into Bitcoin ETFs on August 17. The inflow followed a rough prior week that saw $389.71 million leave the funds, the steepest outflow since early July.
What does Bitcoin’s supply in loss crossing above supply in profit mean?It means more than half of circulating Bitcoin is currently held at a loss for the first time in this drawdown. Similar crossovers preceded major recoveries in 2015, 2018, 2020, and 2022, ranging from 304% to over 11,000%, though the pattern doesn’t guarantee the current cycle repeats that history.
Why are shorts getting liquidated more than longs right now?Short sellers absorbed $70.57 million of the $75.04 million liquidated over 24 hours as price ticked upward and caught bearish bets offside. That pressure cooled within the hour, with longs taking the larger share of liquidations in the most recent hourly data.
What level does $BTC need to clear to turn bullish?$BTC needs a daily close above both the descending trendline from May’s high and the 20-day EMA at $63,849.57, the two levels currently converging at the same price.
Is Bitcoin a good buy right now?Bitcoin is showing a mix of bullish derivatives positioning and a historically significant supply-in-loss crossover, but ETF flows remain choppy and price is still capped by a multi-month downtrend. This is not financial advice, so weigh the bullish and bearish cases above against your own research and risk tolerance.