
Bitcoin’s short-term outlook depends on whether it can reclaim the key $64,000 resistance level while large liquidity clusters continue to build on both sides of the market. A confirmed breakout could expose targets between $65,000 and $67,200, while another rejection may send $BTC toward the heavier liquidity zone between $61,500 and $62,400 first.
Bitcoin Faces a Crucial $64,000 Resistance Test
Bitcoin has returned to the $64,000 area, but the chart does not yet confirm a clean breakout. The next 12-hour close could determine whether $BTC is reclaiming resistance or merely retesting it before another pullback.
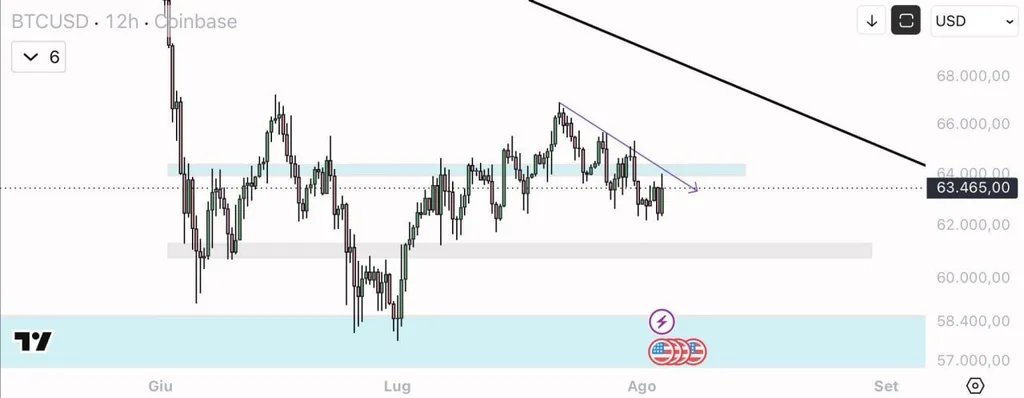
Bitcoin 12-Hour Chart. Source: EliZ (@eliz883) on X
Bitcoin was trading near $63,465 on the Coinbase 12-hour chart after reaching the resistance zone around $64,000. That area previously acted as a major pivot, making a sustained move above it important for the short-term Bitcoin price outlook.
The chart also shows a descending trendline connecting the recent lower highs. Bitcoin remains close to that line, which adds another layer of resistance near the current price. A decisive 12-hour close above $64,000, followed by a successful hold or retest, would strengthen the case that buyers are regaining control.
Such confirmation could allow $BTC to challenge the recent highs between roughly $65,000 and $66,500. However, the chart supports that scenario only after Bitcoin establishes $64,000 as support rather than briefly trading above it.
Failure to reclaim the resistance zone would keep the current move vulnerable to rejection. The recent lows around $62,000 provide the first nearby support area. Below that, the gray demand zone near $61,000 represents a more important level for maintaining the broader recovery structure.
A sustained break beneath that support band would weaken the bullish setup and increase the risk of a deeper decline toward the larger demand region between approximately $57,000 and $58,400.
For now, Bitcoin remains at a decision point. Holding above $64,000 would improve the short-term outlook, while another rejection would leave $BTC trapped below descending resistance.
Bitcoin Liquidity Builds Above and Below the Current Price
Bitcoin is trading between dense liquidity clusters, leaving the market vulnerable to sharp moves in either direction. The heatmap shows the largest nearby concentration below the current price, while several upside targets remain stacked between roughly $65,000 and $67,500.
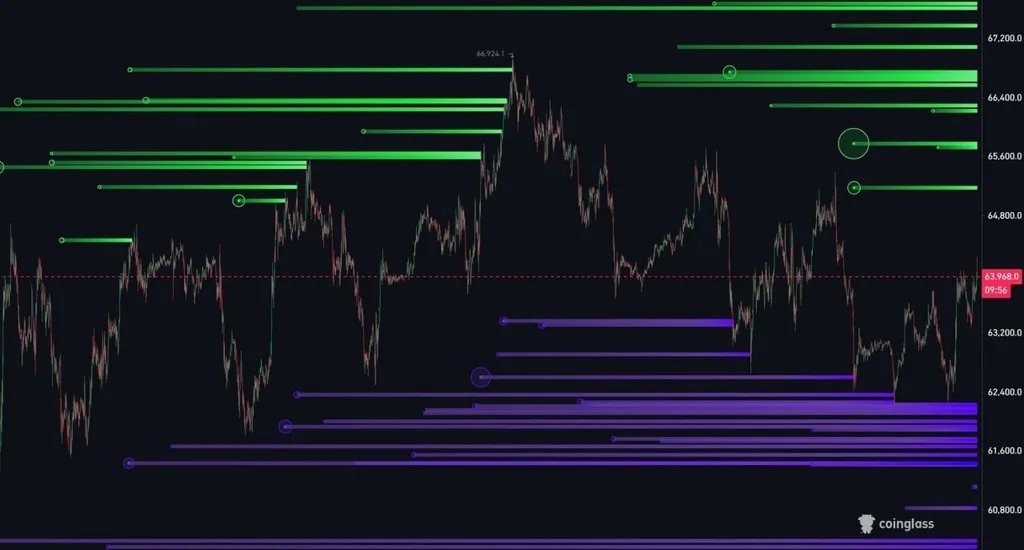
Bitcoin Liquidity Heatmap. Source: Kaz (@XBTkaz) on X
Bitcoin was trading near $63,968 when the chart was captured, placing the price almost midway between the largest liquidity zones. On liquidation heatmaps, brighter horizontal bands mark areas where leveraged positions may be forced to close. These levels can attract price because a move into them may trigger a chain of liquidations and add momentum.
The nearest major downside cluster appears between approximately $61,500 and $62,400. Several purple bands overlap in this region, suggesting that a decline could expose a sizable pool of leveraged long positions. Additional liquidity sits near $60,800, although Bitcoin would first need to break through the broader $61,500-$62,400 area.
Kaz expects the market to target the downside liquidity before reversing higher. That remains a scenario rather than a confirmed sequence, but the chart supports the view that the lower cluster is the closest major liquidity pool. A sustained break below $63,200 could increase the likelihood of a move toward $62,400, followed by the heavier concentration closer to $61,600.
However, Bitcoin also has several upside liquidity targets. The first notable bands appear near $65,200 and $65,700. Larger concentrations sit around $66,300 to $66,800, with additional liquidity extending above $67,200. If $BTC holds above $64,000 and clears the recent intraday highs, those upper levels could become the market’s next targets.
The key issue is order. Bitcoin may sweep one side of the range before moving toward the other, as Kaz suggests, but the chart cannot confirm which pool will be reached first. A downside sweep followed by a quick recovery above $62,400 would support a rebound scenario. By contrast, continued trading below the lower liquidity zone would weaken the case for an immediate move higher.