
Bitcoin is testing a major resistance zone after its four-hour SuperTrend indicator produced a fresh bullish signal near $64,700. A confirmed move above $65,600 could send $BTC toward $67,000-$69,000, while another rejection would raise the risk of a decline toward $61,300.
Bitcoin SuperTrend Flips Bullish Near $64,700
Bitcoin’s four-hour chart shows a fresh SuperTrend buy signal as $BTC trades near $64,656. The indicator’s previous bullish signal on July 3 preceded a 16% advance from $57,700 to $68,900, according to Ali Charts.
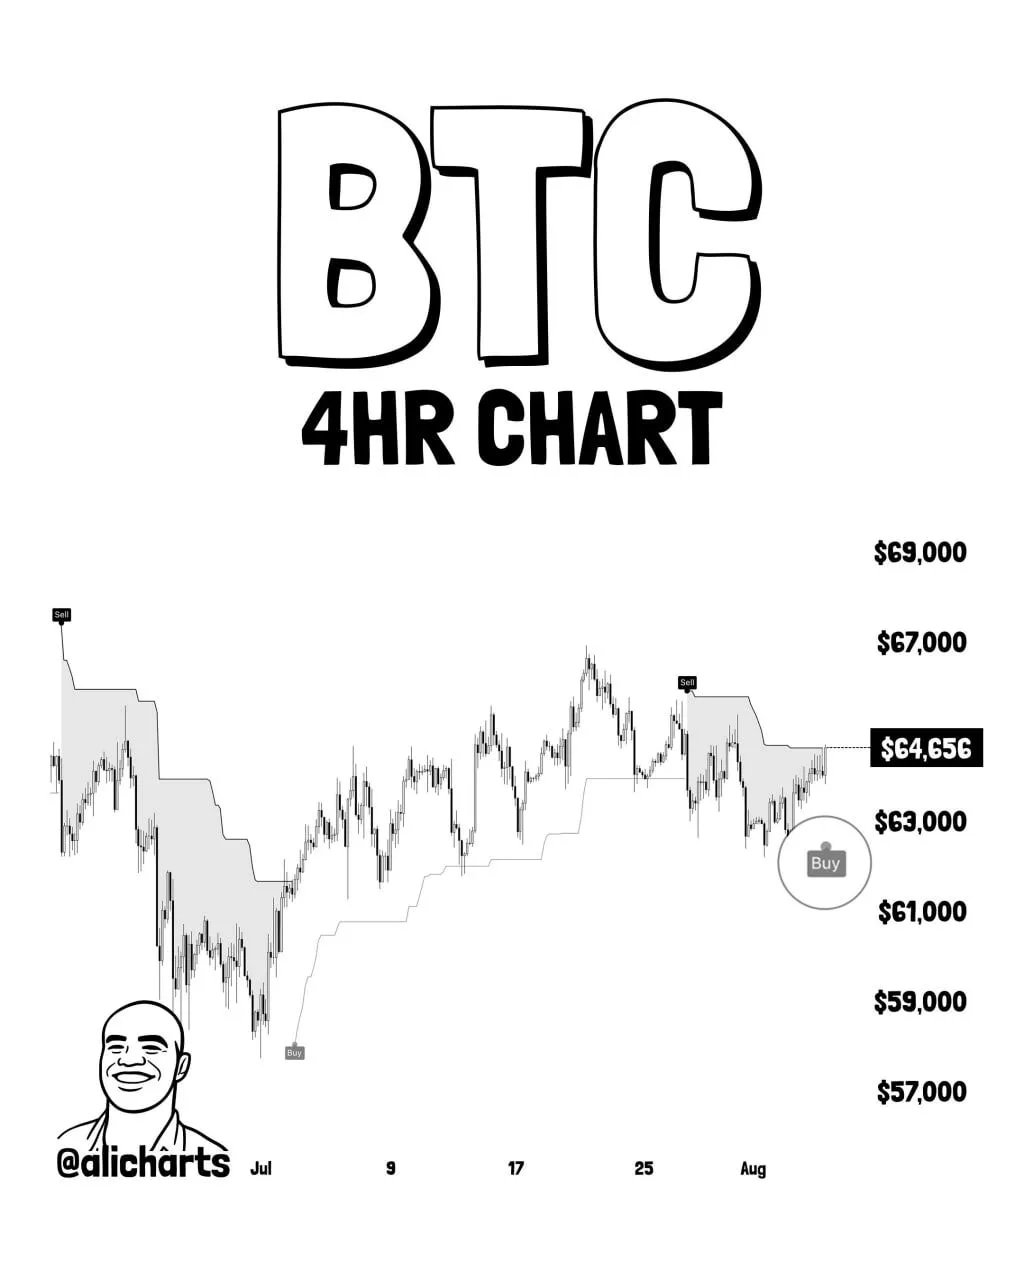
Bitcoin 4-Hour SuperTrend Buy Signal Near $64,656. Source: Ali Charts (@alicharts)
The latest signal suggests short-term momentum has shifted back in favor of buyers after Bitcoin rebounded from the low-$62,000 area. Price has moved above the SuperTrend line, which now acts as dynamic support beneath the market.
Bitcoin must hold above the $63,000 region to preserve the bullish setup. Continued buying could open a move toward $67,000, followed by the chart’s major resistance near $69,000. A sustained break above $69,000 would confirm stronger upside momentum rather than another temporary recovery inside the recent range.
However, the earlier 16% rally does not guarantee that the new signal will produce the same result. A four-hour close back below the SuperTrend line would weaken the setup, while a drop under $63,000 could expose the next support zones near $61,000 and $59,000.
The practical takeaway is that the indicator favors further gains while $BTC remains above its newly established support. Buyers still need a clear breakout through $67,000 and $69,000 to confirm that the broader advance has resumed.
Bitcoin Faces a Make-or-Break Test Near $65,000
Bitcoin has climbed back toward a key decision area near $65,000, where the latest chart shows a heavy concentration of liquidity above the market and a broad support cluster below. Kaz expects this zone to determine whether $BTC extends its recovery toward $67,000-$68,000 or reverses toward $61,300.
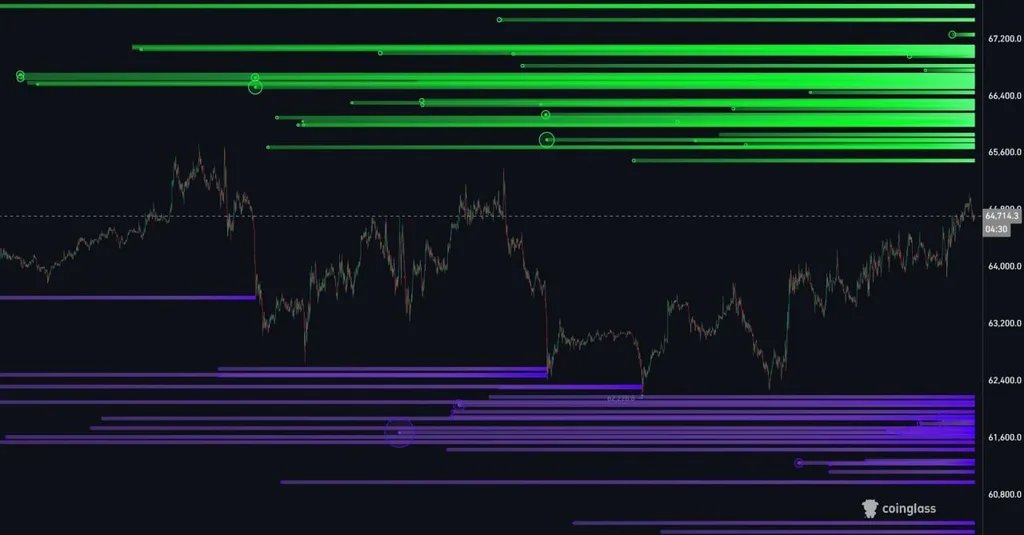
Bitcoin Liquidity Map at the $65,000 Decision Level. Source: Kaz (@XBTkaz), chart data from CoinGlass
Bitcoin trades near $64,714 on the chart, leaving price just below the resistance band between $65,200 and $65,600. That range previously marked the start of a decline, so another rejection would support the bearish scenario outlined by Kaz.
The downside setup would gain strength if Bitcoin fails to clear $65,000 and begins losing recent short-term support. The chart shows a dense liquidity cluster between roughly $60,800 and $62,200, with $61,300 identified as the main bearish target. A sharp rejection could accelerate the move because leveraged positions may be forced to close as price falls.
However, the bearish view has a clear invalidation point. A sustained break above $65,200-$65,600 would change the short-term market structure and increase the chance of a liquidity-driven rally.
The chart displays several large liquidity bands above price, beginning near $65,500 and extending through the $67,000 area. If Bitcoin enters those zones, short liquidations could add buying pressure and help push $BTC toward $67,000-$68,000. That region also contains the upper price imbalance highlighted in the original analysis.
Traders should watch for confirmation rather than treating an intraday move above $65,000 as a completed breakout. Holding above $65,600 would favor the bullish scenario, while a quick move above resistance followed by a drop back below it would raise the risk of a false breakout.
The practical takeaway is that Bitcoin remains caught between two large liquidity zones. A confirmed breakout above $65,600 could expose $67,000-$68,000, while rejection at the current resistance area would shift attention back toward $61,300.