
Bitcoin is pulling back after a channel rejection, putting the $61,200-$60,700 liquidity zone in focus. If buyers defend that area, $BTC could still recover toward $65,700-$67,400, but losing support may open the door to $59,700 or lower.
Bitcoin Channel Rejection Puts $59.7K Back in Focus
Bitcoin is getting rejected near the top of its 4-hour channel, putting short-term downside levels back in focus. If sellers keep control, $BTC could pull back toward $59,700, with $56,550 as the next deeper target.
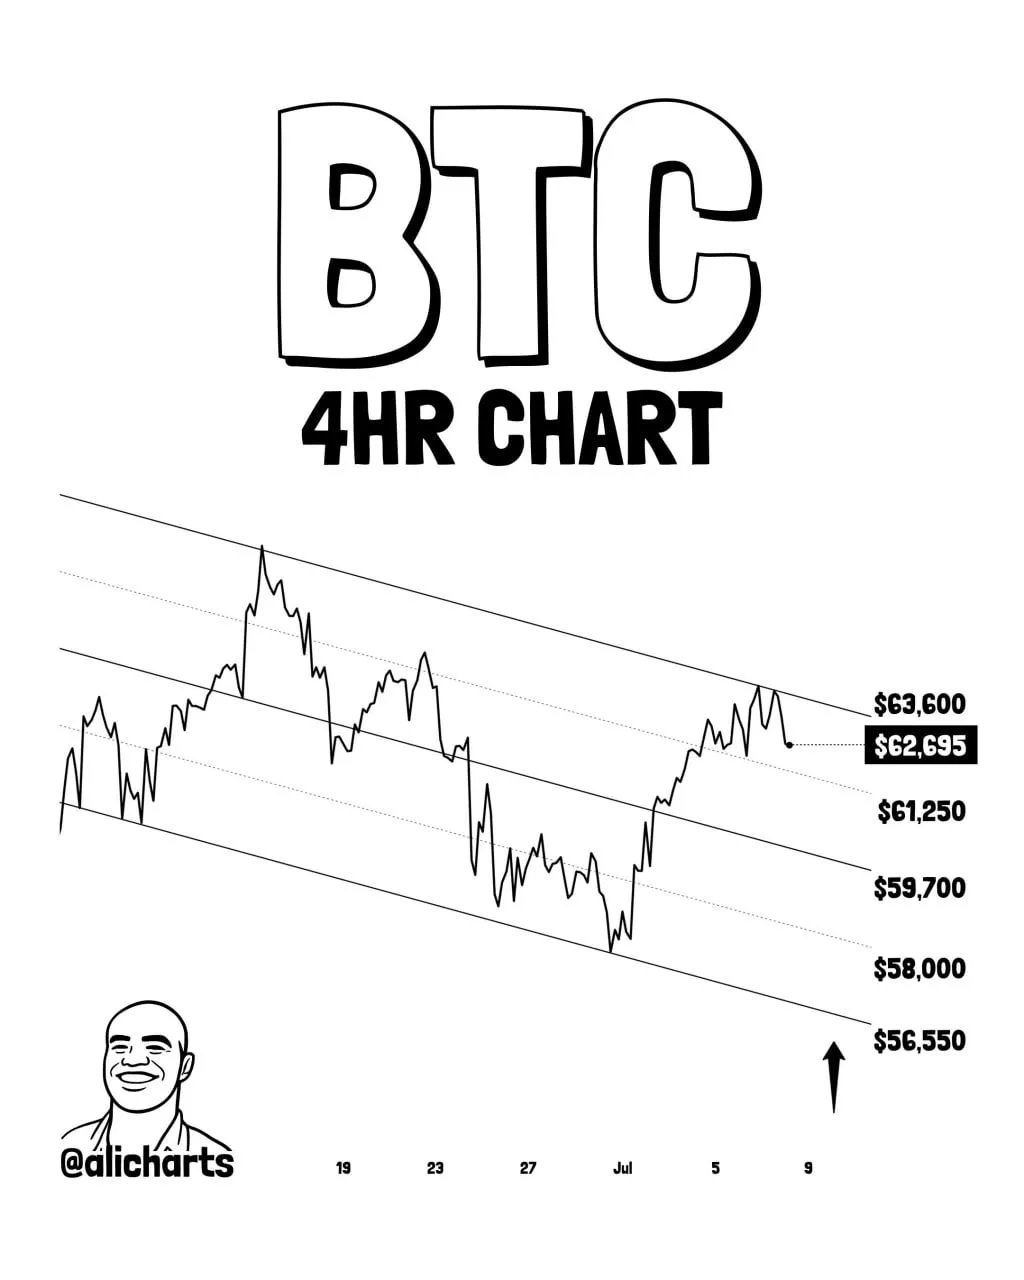
$BTC 4-hour chart. Source: Ali Charts on X, TradingView
The chart shows Bitcoin trading inside a descending channel, with price recently pushing into the upper boundary before turning lower.
That rejection matters because the top of the channel has acted as resistance during the latest structure. If $BTC fails to break above it, the move could shift back toward the middle or lower part of the channel.
According to Ali Charts, the first downside target sits near $59,700. That level lines up with a lower channel area and could become the next key support if the pullback continues.
Below that, the chart points to $56,550 as the next major downside level. A move into that zone would suggest sellers are still controlling the broader short-term structure.
The nearby levels at $61,250 and $58,000 may also matter during the move. They could act as temporary reaction areas if price starts sliding lower.
However, the bearish case still needs follow-through. If $BTC reclaims the upper channel area and breaks above $63,600, the pullback setup would weaken.
For now, the channel rejection is the main signal. Holding below the top of the range keeps $59,700 in focus, while a stronger breakdown could open the path toward $56,550.
Bitcoin Liquidity Sweep Could Decide the Next Move Toward $67K
Bitcoin is ranging above a key liquidity zone, with one analyst watching for a possible sweep into the $61,200-$60,700 area before another move higher. If buyers defend that zone, $BTC could later target the $65,700-$67,400 region.
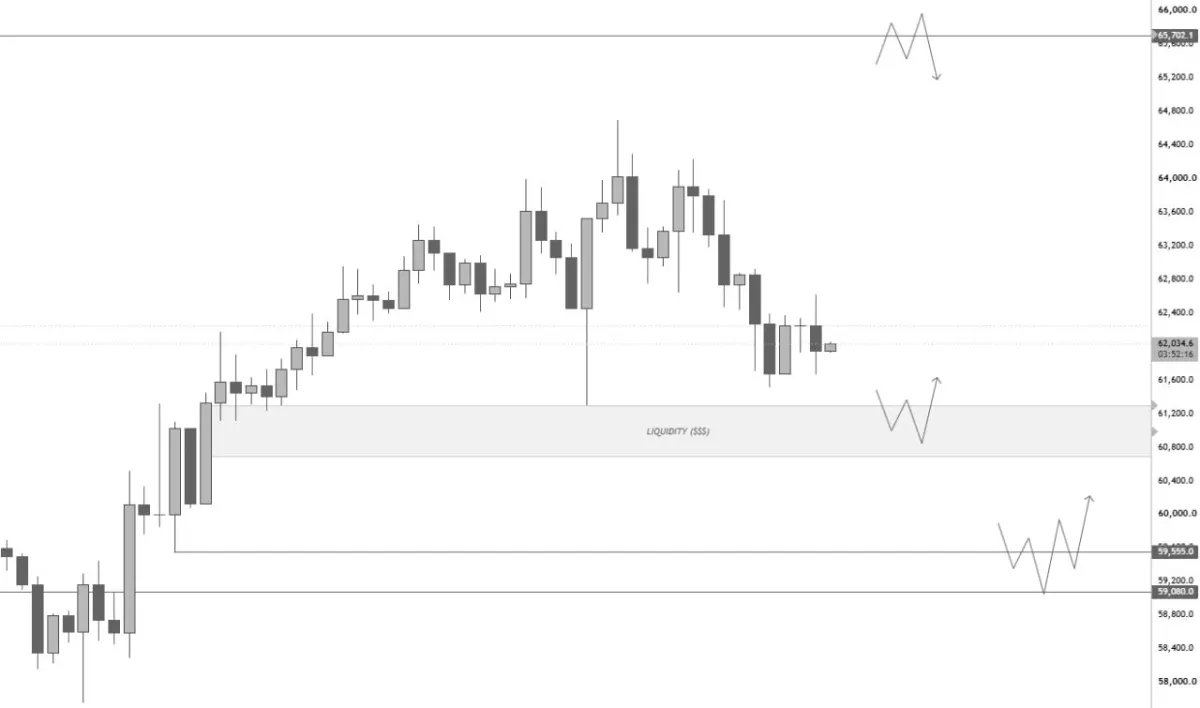
$BTC 4-hour chart. Source: Minga on X, TradingView
The chart shows $BTC pulling back after its recent move higher and now trading above a grey liquidity box marked between roughly $61,200 and $60,700.
According to Minga, this is the first major liquidity zone to watch. He said price may sweep into that area before attempting another move higher.
That zone matters because $BTC is still holding just above it. If buyers step in there, the pullback could become a liquidity grab rather than a deeper breakdown.
However, the setup has a second downside level. If Bitcoin breaks below the grey box, Minga expects a move toward $59,500, which he called the main magnet to the downside.
The analyst also said this is the last major support zone for bullish continuation. If the bottom is truly in, $BTC needs to hold this area on the retest.
A strong reaction from either $61,200-$60,700 or $59,500 would keep the recovery case alive. From there, the chart suggests $BTC could push toward $65,700-$67,400 later this month.
For now, the pullback is the key test. Bitcoin needs to defend support before the next upside leg becomes more likely.