
Bitcoin is showing short-term strength after reclaiming key moving averages, but analysts still want confirmation before calling a full bullish reversal. If $BTC holds the $60,500-$61,300 support area and breaks above the 50-day average, the next upside zones could come into play.
Bitcoin Golden Pocket Test Keeps Bulls Waiting for Confirmation
Bitcoin has bounced from the $60,500-$61,000 area, but one analyst says it is still too early to call the move bullish. The next test is whether $BTC fills the wick near $61,300, holds support and then breaks market structure.
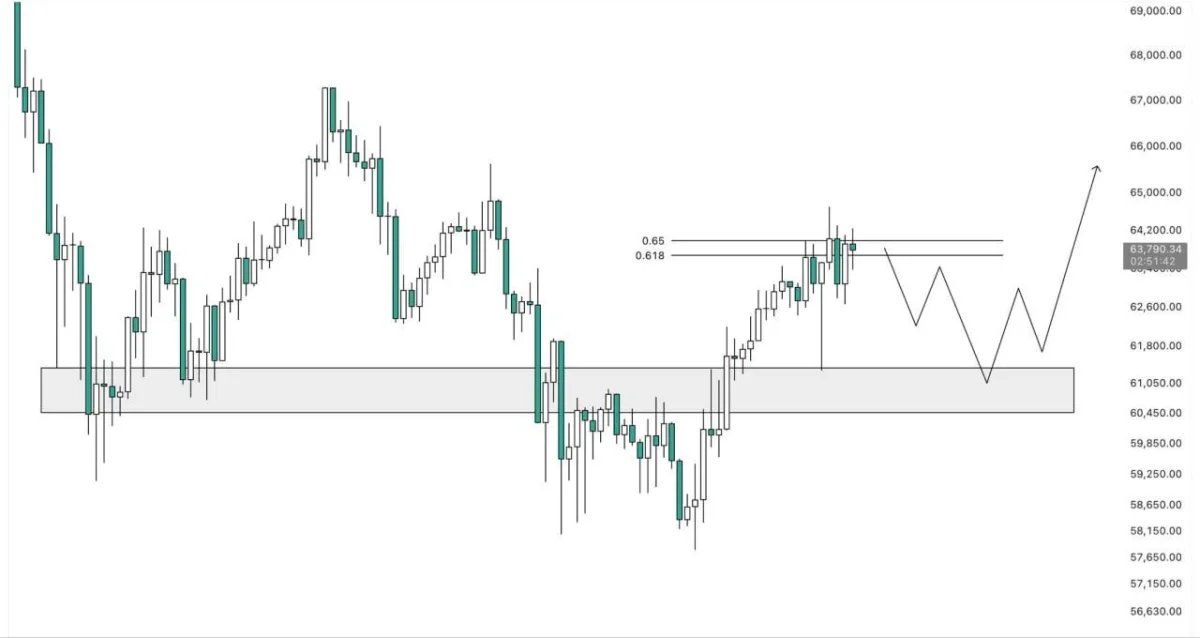
$BTC chart. Source: Max Trades on X, TradingView
The chart shows $BTC reclaiming the $60,500-$61,000 support zone before bouncing sharply from that area.
According to Max Trades, the strong lower wick shows buyers reacted, but the broader mid- to high-timeframe structure still remains bearish.
$BTC is now testing the Golden Pocket of the current downtrend, which sits near the 0.618-0.65 Fibonacci retracement area. That zone often acts as resistance during bearish retracements.
The analyst said he is not ready to flip bullish yet. He wants to see price revisit the wick area around $61,300 and form a proper low first.
If that support holds, another bounce could follow. From there, a break of structure would make the bullish reversal case more realistic.
However, if $BTC rejects from the Golden Pocket and loses the $60,500-$61,000 area, the recovery setup would weaken again.
For now, Bitcoin’s next move depends on support confirmation. Holding the wick zone could keep a bounce alive, while failure there would keep bears in control.
Bitcoin Bullish Cross Gives Bulls a Short-Term Lifeline
Bitcoin is flashing a short-term bullish cross on the daily chart, but the move still needs confirmation. $BTC remains below heavier resistance, with several fair value gaps and liquidity zones waiting above.
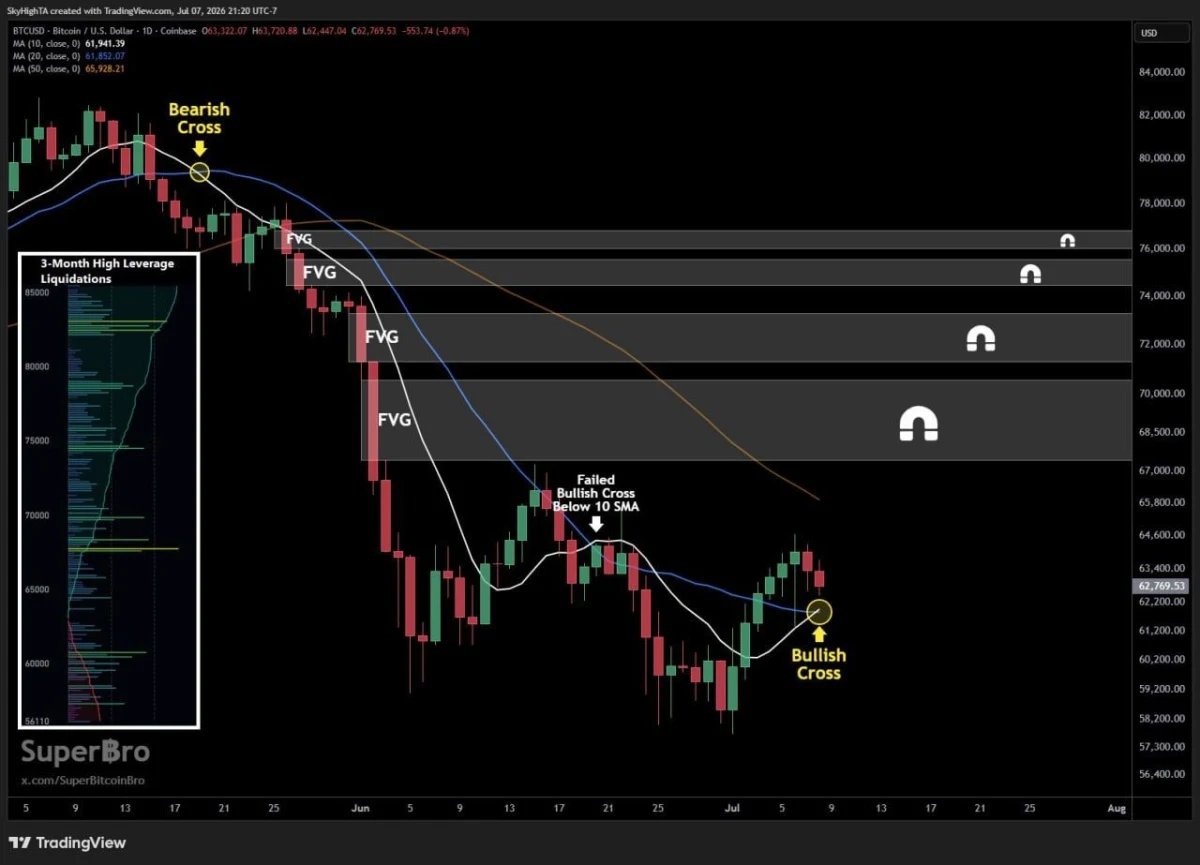
$BTC/USD daily chart. Source: SuperBro on X, TradingView
The chart shows $BTC recovering from the late-June low area and pushing back above the 10-day and 20-day moving averages.
A bullish cross has now appeared near the current range, suggesting short-term momentum is trying to turn back in favor of buyers.
However, the setup is not fully bullish yet. Bitcoin is still trading below the 50-day moving average, which sits near $65,928 and remains one of the first major resistance levels.
The chart also shows several fair value gaps above price. These zones sit around the $67,000-$68,500 area, the $71,000-$73,000 area and the larger $74,000-$76,000 range.
Those gaps could act as upside magnets if $BTC keeps recovering. The liquidation map on the chart also shows large leverage clusters above current price, which may attract price if momentum strengthens.
Still, buyers need follow-through. A failed move above the moving averages could turn this into another lower-high setup and bring recent support back into focus.
For now, the bullish cross is the main short-term signal. If $BTC holds above the 10-day and 20-day averages, the next test could be the 50-day moving average and the first major FVG above.