
Bitcoin is bouncing from its weekly Bollinger Band support, but the next move may not be clean. If $BTC holds $62,700 and sweeps $65,600, bulls could keep the path toward $70,000 alive, while rejection there may send price back toward $60,500.
Bitcoin Bollinger Band Bounce Puts $70K Back in Focus
Bitcoin has bounced from the lower weekly Bollinger Band, giving bulls a clear recovery setup after weeks of weakness. If momentum holds, the next key test sits near the middle band around $70,000.
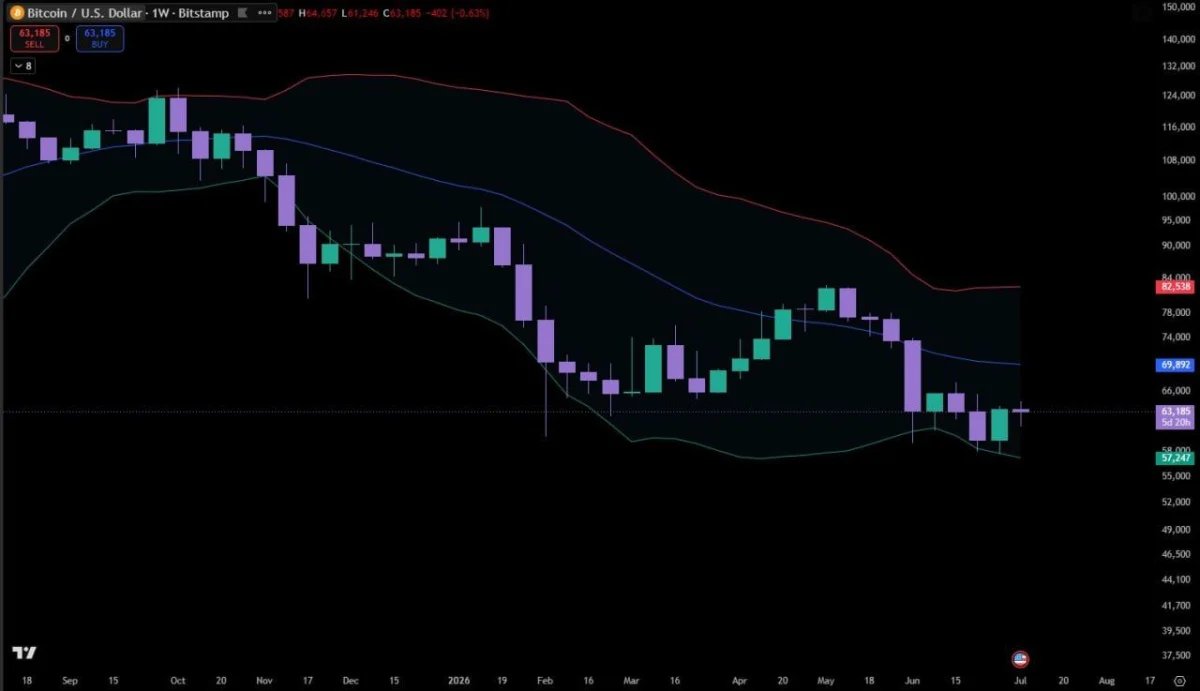
$BTC/USD weekly chart. Source: Sky on X, TradingView
The chart shows $BTC reacting from the lower Bollinger Band, which sits near $57,247. That level has acted as the main downside boundary on the weekly chart.
According to Sky, the bounce suggests the lows may be in and the next move could target $70,000.
That target lines up with the middle Bollinger Band, shown near $69,892. In this setup, reclaiming the middle band would be the first stronger sign that buyers are regaining control.
If Bitcoin clears that area, the next major upside level would be the upper band near $82,538. That would require stronger momentum and broader confirmation.
However, the bullish case still depends on $BTC holding above the lower band. A move back below that area would weaken the bounce and put the recent lows back in focus.
For now, the lower-band reaction is the main signal. Holding that bounce keeps the $70,000 target alive.
Bitcoin Could Sweep $65.6K Before Pullback Toward $60.5K
Bitcoin may extend higher before making its next major pullback, with one analyst watching $65,600 as the next liquidity target. A dip toward $62,700 could come first, but the broader setup still points to a possible rejection from higher resistance.
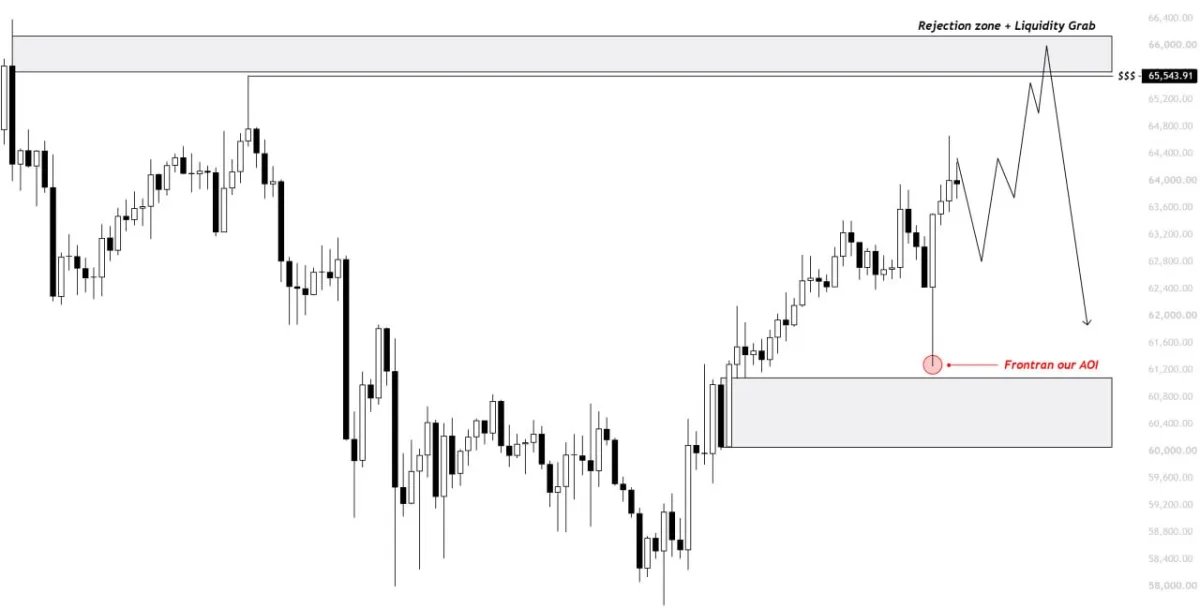
$BTC price action chart. Source: Kaz on X, TradingView
The chart shows $BTC rebounding after price moved close to the $60,000-$61,000 area but did not fully enter the analyst’s zone of interest.
According to Kaz, that area was front-run, meaning buyers stepped in before price reached the expected support zone. $BTC has since moved back toward the $64,000 area.
The analyst now expects Bitcoin to extend higher before revisiting deeper downside liquidity. The next upside target sits near $65,600, where the chart marks a rejection zone and liquidity grab area.
Before that move, Kaz is watching for a pullback toward $62,700. He said that level lines up with the monthly point of control and a fair value gap, making it an important short-term support area.
If $BTC holds $62,700, the chart suggests price could continue higher and clear the $65,600 highs. However, that move may not confirm a full bullish breakout.
Kaz said he would look for short entries near $65,600. From there, the chart points to a possible rejection and move back toward downside liquidity near $60,500.
For now, the key path is simple. Bitcoin may test $62,700 first, then push toward $65,600 before sellers try to regain control.