
Bitcoin may keep sweeping liquidity across its range, with another move toward $67,000 and possibly $74,000-$76,000 still in play. However, both charts warn that the rally could fail and send $BTC toward $55,000 or the low-$50,000 area before a larger recovery.
Bitcoin Midterm Pattern Points to a Rally, Crash, Then New Highs
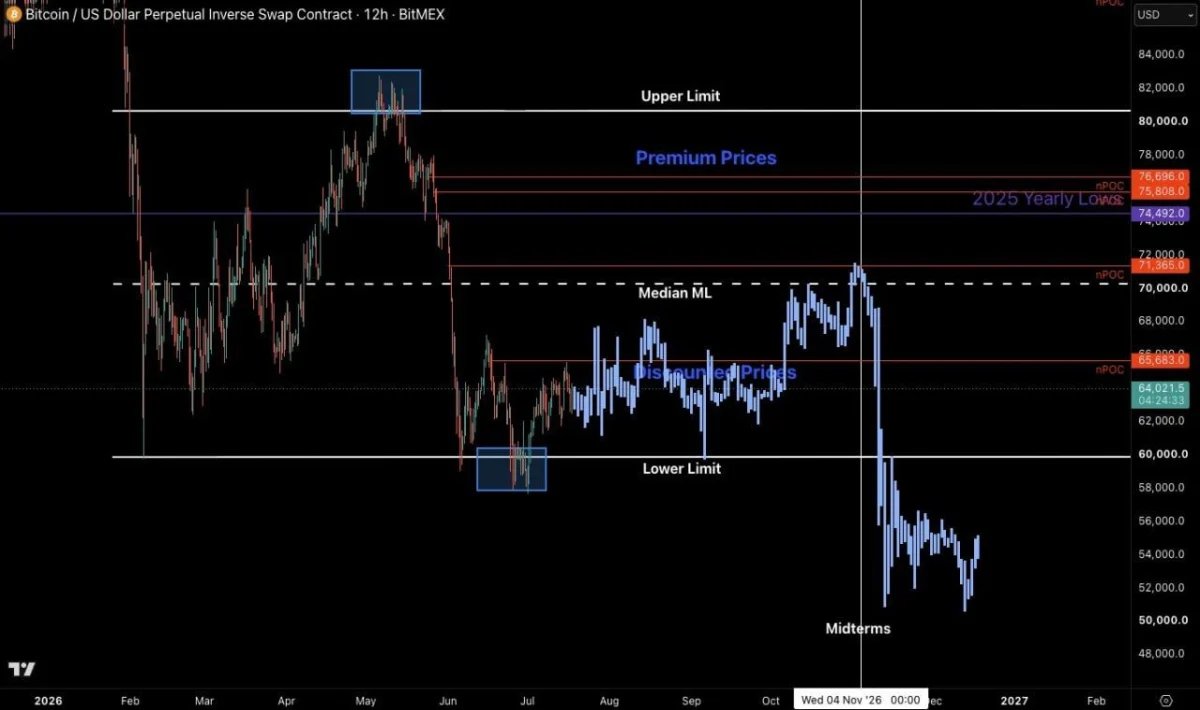
Bitcoin could stage a recovery into the 2026 U.S. midterm elections before suffering a sharp post-election decline, according to Castillo Trading. The projected path then shows $BTC recovering from the low-$50,000 area and eventually moving toward new highs.
$BTC 12-hour chart. Source: Castillo Trading/X.
The chart places Bitcoin below the midpoint of a broad range, with the lower boundary near $60,000 and the median around $70,000. A recovery above $65,683 could first open the way toward $70,000-$71,365.
Stronger momentum would bring the $74,492-$76,696 premium zone into focus. However, this area could attract heavy selling because it includes the 2025 yearly open and several volume-based resistance levels.
The projected post-midterm decline sends $BTC below $60,000 and toward roughly $51,000-$56,000. A breakdown of that size would likely trap late buyers and clear liquidity below the range before a longer-term recovery begins.
Still, the setup depends on Bitcoin following earlier midterm patterns, which is not guaranteed. Reclaiming $70,000 and holding above the premium zone would weaken the projected crash, while losing $60,000 would give the bearish path stronger confirmation.
Bitcoin Liquidity Map Points to One More Range Sweep
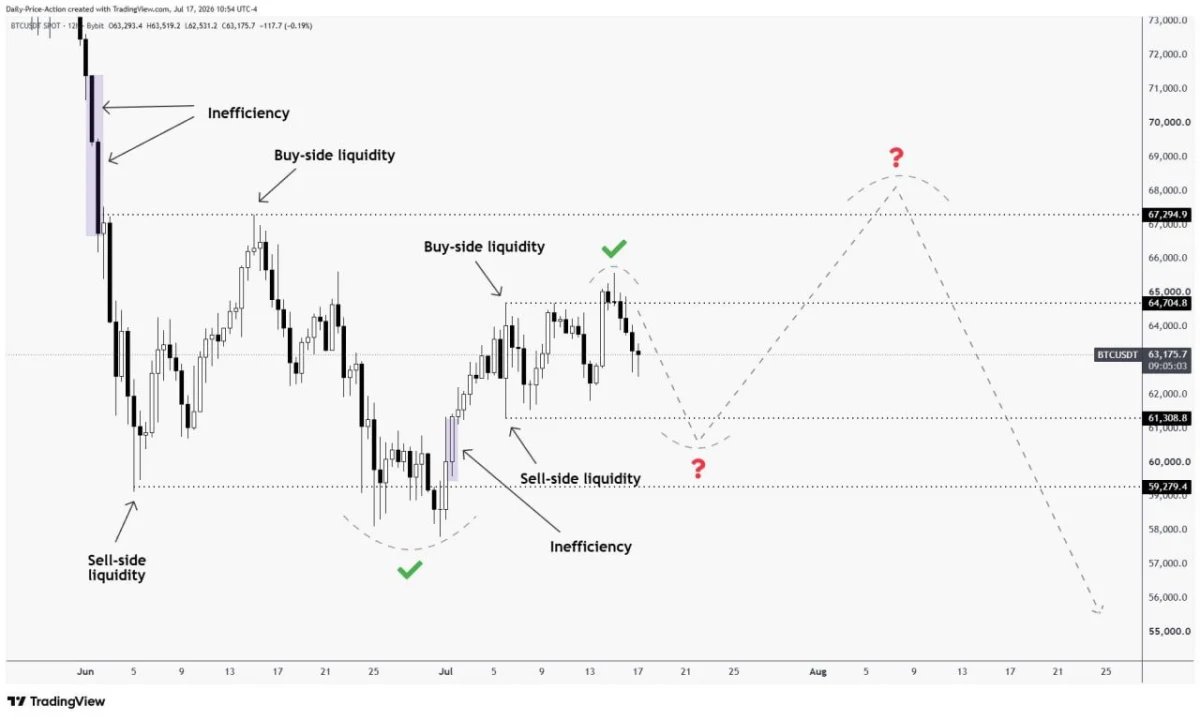
Bitcoin remains trapped between key liquidity levels, with price likely to target one side of the range before making its next larger move. The chart suggests $BTC could first fall toward $61,300, rebound toward $67,300 and then face another deeper decline.
$BTC 12-hour chart. Source: Justin Bennett/X
Bitcoin recently swept liquidity above $64,700 and reversed, repeating the same behavior seen near earlier range highs. That rejection shifts attention to the sell-side liquidity near $61,300.
A break below that level could extend the move toward $59,300, where another large liquidity pool sits. A quick recovery from either zone could then set up a rebound toward $64,700 and eventually $67,300.
However, a rejection near $67,300 would keep the broader range intact and raise the risk of a deeper fall toward $55,000. Bennett’s longer-term $44,000 target remains unchanged, although the chart does not confirm that move yet.
The setup improves if Bitcoin breaks above $67,300 and holds the level. Until then, traders may continue seeing sharp liquidity sweeps in both directions rather than a clean trend.