
Bitcoin trades at $63,963 on July 30, down 2%, as a hawkish Fed hold and a looming September rate hike debate collide with a weekly RSI divergence that historically signals the opposite of what the macro backdrop suggests. Four analysts read the same Fed decision and reached four different conclusions about what August holds.
The Weekly Chart Has a Bullish Signal Inside a Bearish Structure
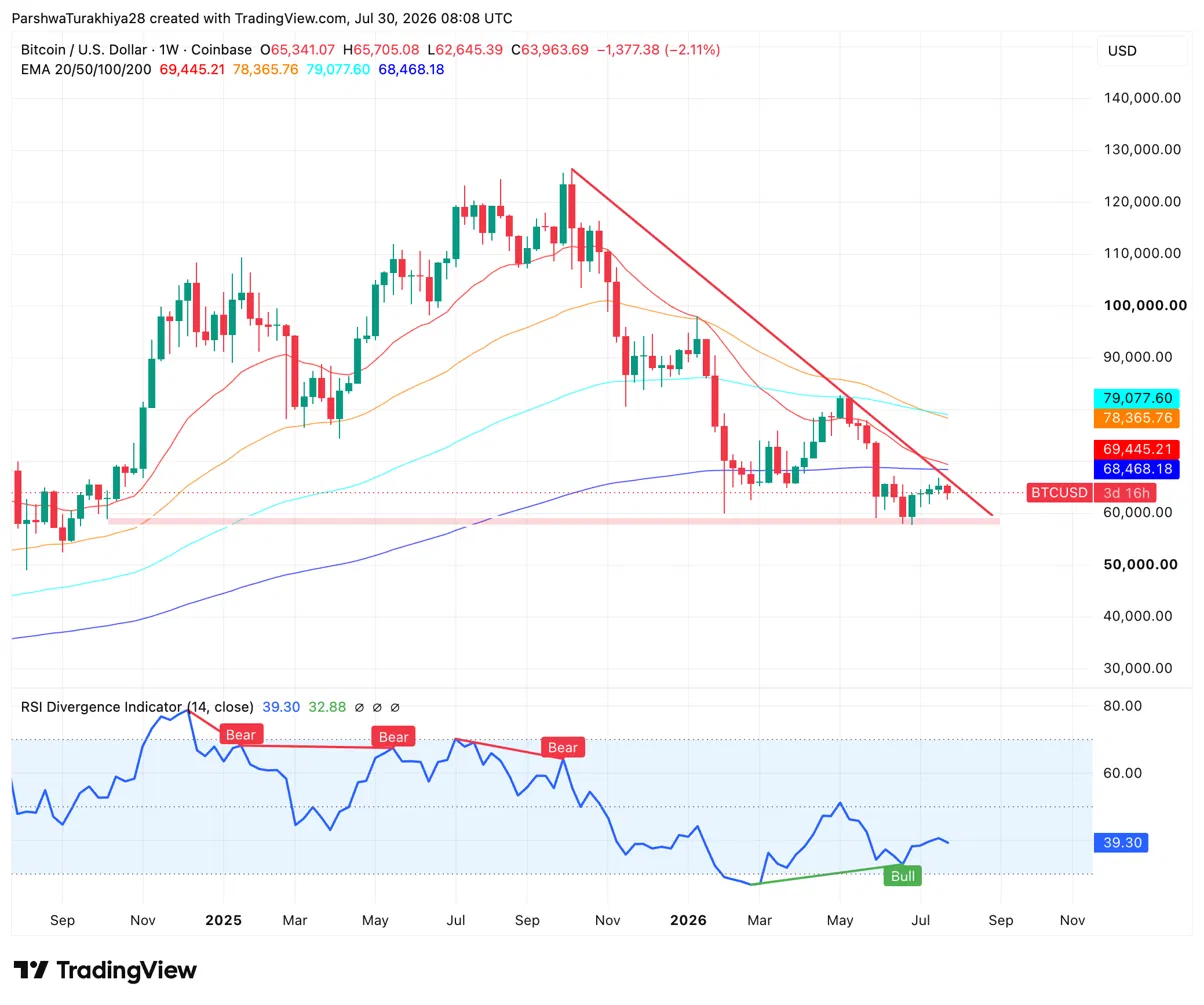
The weekly chart shows $BTC pressing against a descending trendline from the October 2025 peak near $126,000, with price sitting just below that trendline near $64,000 after the Fed decision. A horizontal support band near $60,000 to $62,000 has held through multiple tests since the June low and remains the floor bulls need to defend heading into August.
All four weekly EMAs slope downward above price. The 20-week at $69,445 is the nearest ceiling, followed by the 50-week at $78,365, the 100-week at $79,077, and the 200-week at $68,468. The RSI Divergence Indicator at 39.30 is the most important signal on the weekly chart. Price made a lower low in June while RSI made a higher low, printing a bullish divergence with the signal line at 32.88. That same setup appeared before each of the major recoveries visible on the chart. The prior three bearish divergences on this timeframe correctly called the 2025 top and the subsequent selloffs. A bullish divergence at this stage of the cycle carries equal weight in the opposite direction.
What Are The Key Support And Resistance Levels For $BTC In August?
Resistance Levels
- $65,705 — Weekly session high and bear market resistance band
- $68,468 — 200-week EMA, key higher timeframe level
- $69,445 — 20-week EMA, declining and capping weekly recoveries
- $78,365 — 50-week EMA, extended resistance
Support Levels
- $62,645 — Weekly session low and recent test of the support band
- $60,000 — $62,000 — Horizontal support zone, key floor from June
- $57,500 — June low, last defense before uncharted 2026 territory
Has August Historically Been Strong For Bitcoin?
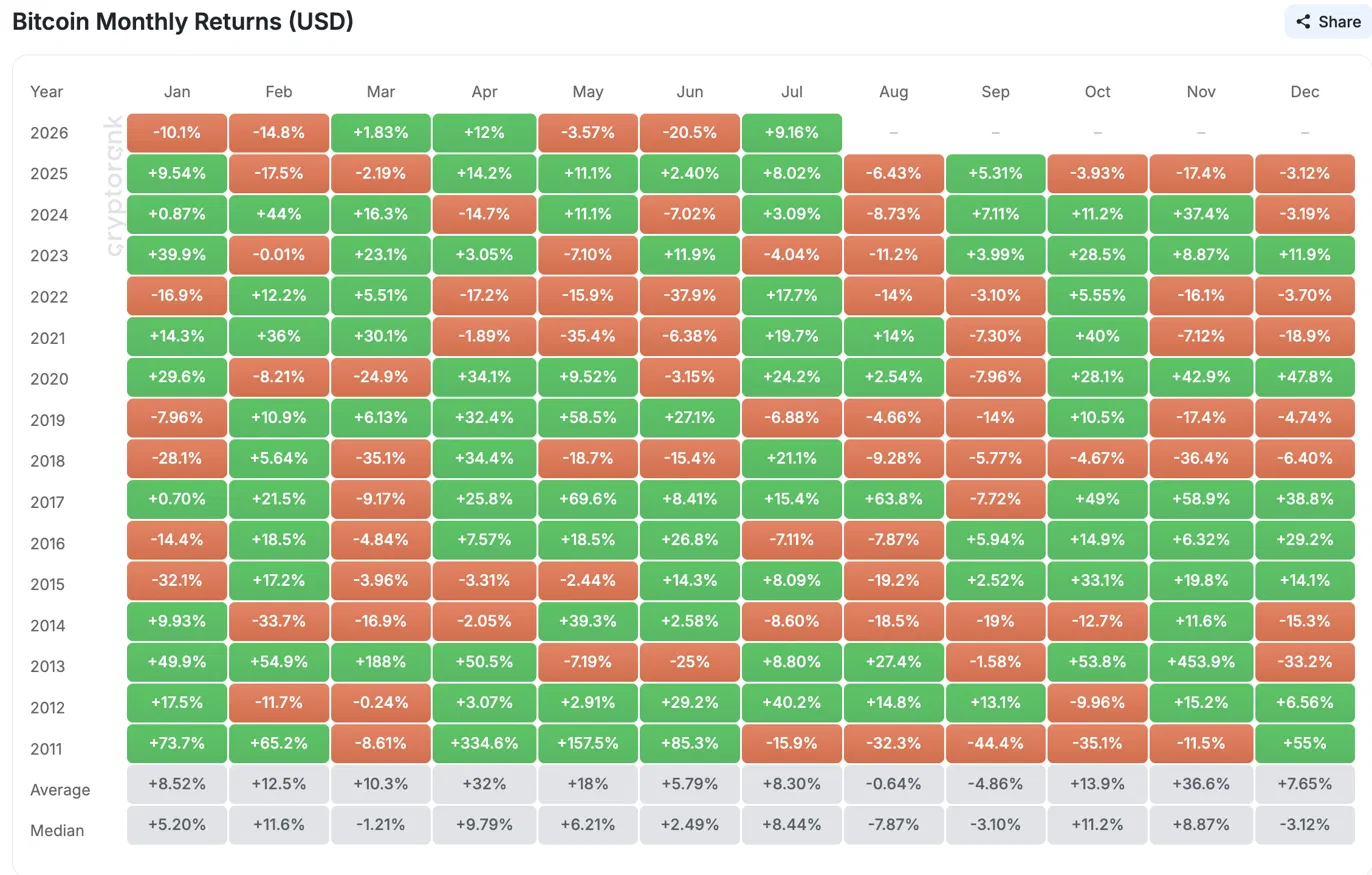
The seasonal data makes a clear case for caution. Across 15 years, August has averaged -0.64% with a -7.87% median — the only month with a negative median return across Bitcoin’s entire history.
August has closed red nine times in those fifteen years. The notable losses include -32.3% in 2011, -14% in 2022, -8.73% in 2024, and -6.43% in 2025.
Related: Pi Network Price Prediction August 2026: Will the August 11 Node Deadline Be the Catalyst PI Needs to Recover?
The 2026 context amplifies the concern. July closed up 9.16%, matching the historical average closely. In 2022 and 2018, the two years Cowen uses for his analog, July was green and August reversed those gains entirely.
$BTC August 2026 Weekly Forecast
Four Analysts, One Fed Decision, Four Different Reads
DWF Labs: The Worst Possible Outcome
DWF Labs managing partner Andrei Grachev called the hawkish hold the least favorable outcome on the table this cycle. Three regional Fed presidents dissented in favor of an immediate hike, and Chair Kevin Warsh opened his press conference stating there is no soft inflation target and that any reading above 2% is unacceptable. Grachev argued tighter liquidity makes leveraged crypto positions more expensive to hold and said institutional positioning should shift defensive immediately.
Sygnum Bank: Expected and Staying Constructive
Sygnum Bank investment strategist Can-Luca Köymen took the opposite view, noting the hawkish hold was exactly what his firm expected. He argued a restrictive Fed is not the same as a deteriorating backdrop, and that Sygnum’s constructive crypto stance was never built on rate cuts. His firm is watching ETF flows and on-chain accumulation as the deciding signals rather than Fed language.
Bitget: Pressure Goes to Nasdaq, Not Bitcoin
Bitget chief analyst Ryan Lee argued the debate has already shifted from whether the Fed cuts this year to whether the next move is a hike. He noted June’s soft CPI is likely to reverse in July data given oil’s Hormuz-driven reversal. He expected the immediate pressure to concentrate in the Nasdaq rather than Bitcoin, citing continued institutional dip-buying as evidence that demand discipline has not broken down.
21Shares: September Is the Real Test, Not August
21Shares head of macro Stephen Coltman was the most explicitly forward-looking, describing Wednesday’s outcome as a sigh of relief that sets up a potentially fraught September meeting. With Fed funds futures now pricing a 72% probability of a September hike and three sitting regional presidents already wanting to hike in July, Coltman identified September as the real decision point for Bitcoin rather than the August consolidation period.
Benjamin Cowen’s 2018 Analog Says August Losses Are Coming
As covered by Coin Edition earlier, Cowen’s structural argument maps 2026 against 2018 with precision. The February low, the higher low in late March, the June sweep, and the July countertrend rally have all tracked the 2018 sequence.
In that year, the July rally ended in late July and August reversed all gains before an even deeper Q4 low. Cowen’s base case is an August to September pullback forming the market cycle bottom in Q4 where on-chain indicators historically reset. His pivot condition remains unchanged: if $BTC has not broken down by year-end, he calls the bull market back on.
ETF Flows Returned Positive But The Weekly Trend Is Still Negative
Spot Bitcoin ETFs recorded $32.1M in net inflows on July 29, ending a four-session outflow streak that totaled over $500M according to SoSoValue. Weekly net outflows still stand at $29.29M despite the single positive session.
Monthly net inflows have reached $204.7M in July, slightly above Ethereum ETF monthly inflows of $342.9M for the same period. Cumulative inflows across all $BTC ETF products stand at $51.36B. The single positive session is encouraging but does not yet signal the kind of sustained inflow streak that preceded the July highs.
Bitcoin Price Prediction August 2026: Upside and Downside Targets
The bullish case requires the weekly RSI divergence to confirm, $BTC to hold the $60,000 to $62,000 support band, the CLARITY Act to pass before the August 8 recess, and ETF inflows to resume a positive streak. If those conditions align, $BTC targets the 200-week EMA at $68,468 and the 20-week EMA at $69,445 as the sequential upside levels as Köymen’s constructive thesis plays out.
The bearish case follows Cowen’s 2018 analog and the seasonal data simultaneously. August seasonal weakness combines with September rate hike probability repricing, $BTC loses the $60,000 to $62,000 support band, and price targets the June low at $57,500 as tighter liquidity pressures leveraged positions the way Grachev outlined. The CLARITY Act missing the August 8 window removes the last near-term policy catalyst and adds to the downside pressure.