
Bitcoin price pulled back to about $64,300 on Aug. 19 after failing to hold above $65,000, as weak spot demand, rising bond yields, and resistance near $65,400 limited the rebound.
Bitcoin price stalls below $65,000
According to data from crypto.news, Bitcoin ($BTC) price was trading at about $64,390 on Binance on Wednesday afternoon in Asia, down roughly 0.5% on the daily candle. The price had reached an intraday high of $64,736 before sellers pushed it lower.
The retreat followed a rebound from the $62,700 area earlier in the week. Bitcoin moved through $64,000 and approached $65,000 on Aug. 18, but the rally did not attract enough buying pressure to clear the upper end of its recent range.
Trader Lennaert Snyder said Bitcoin had again been rejected from the high of its compression range. He identified $65,400 as the level keeping the asset inside the range and said a loss of the $64,000 previous-day low could send the price back toward the lower boundary.
Snyder said he was maintaining a short position opened near $65,000 but planned to move it to breakeven if possible. His downside scenario depends on Bitcoin losing $64,000, while another defense of the $62,500 range low would leave the market increasingly compressed.
Bitcoin has traded mostly between $62,500 and $65,400 since late July, aside from brief moves outside the range. Repeated reversals have reduced the value of entries near the middle, where neither buyers nor sellers have established control.
Low trading volume limits the Bitcoin rebound
Thin spot activity remains one of the main obstacles to a sustained breakout. Analyst Gerla said Binance spot volume had declined for years, even as Bitcoin continued to hold around $64,000.
$BTC volume is drying up… and that's exactly what I want to see.
— Gerla 🦁 (@CryptoGerla) August 19, 2026
Binance spot volume has been declining for years while price holds $64K. Most traders see this as bearish.
I see it as exhaustion. Sellers are running out.
Quiet markets like this are where explosive moves are… pic.twitter.com/siLMHHxbf5
Gerla interpreted the decline as possible seller exhaustion rather than an immediate bearish signal. However, lower volume also means that the recovery has received limited confirmation from buyers.
Binance data published earlier in August showed how activity has shifted toward leveraged products. Bitcoin futures volume on the exchange reached about $57.82 billion in one session, compared with $6.08 billion in spot volume.
The resulting futures-to-spot ratio reached 7.82, according to CryptoQuant data. Futures therefore accounted for almost eight times as much activity as spot trading, leaving short-term price moves more exposed to leveraged positioning and liquidation-driven volatility.
Institutional demand has also weakened. U.S. spot Bitcoin exchange-traded funds recorded about $385.2 million in net withdrawals during the week through Aug. 14. The outflows followed $853.5 million in inflows in the previous five trading sessions.
Lower ETF demand and weak exchange volume have reduced the buying pressure available near resistance. Both measures would need to improve for a breakout above $65,400 to receive stronger market confirmation.
Bitcoin charts identify $65,350 as resistance
The daily chart shows Bitcoin trading just above the middle Bollinger Band at $63,895. The upper band stands at $65,350, closely matching the resistance that stopped the latest recovery.
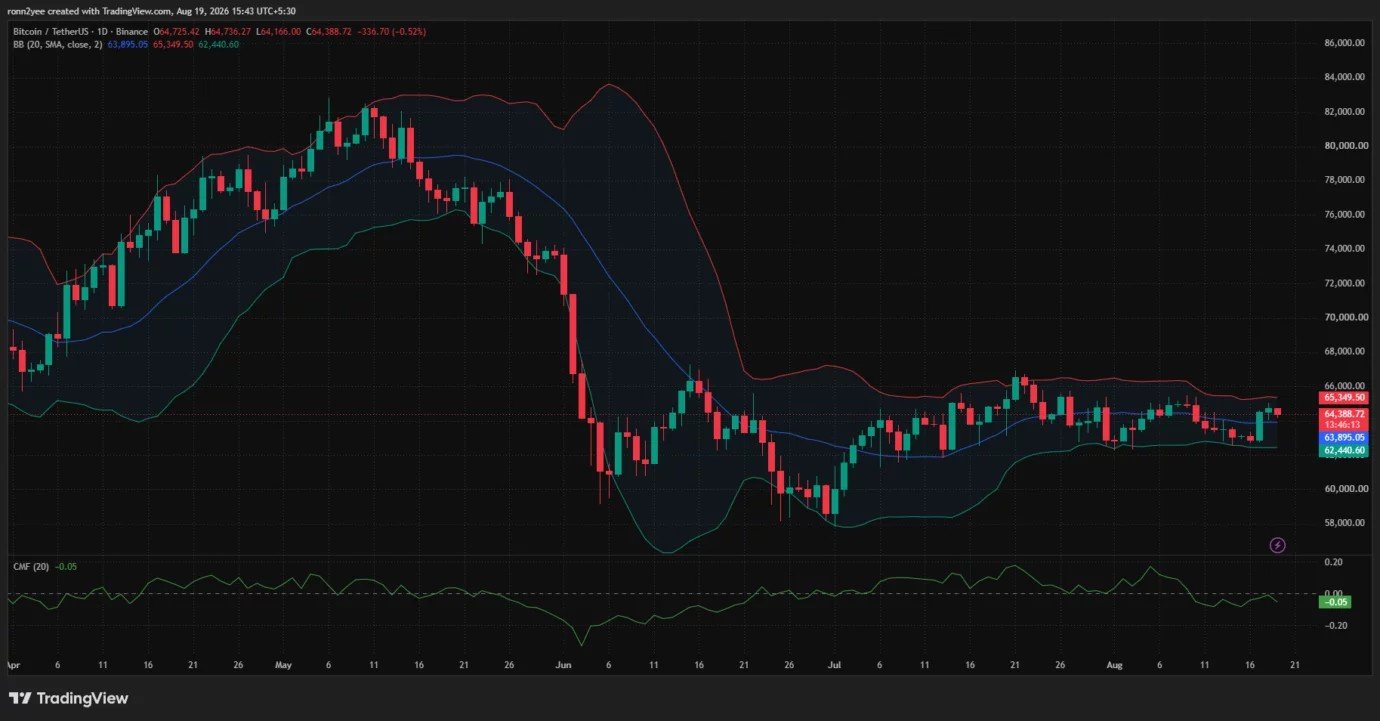
A daily close above $65,350 would place Bitcoin outside the upper edge of its recent volatility range. Such a move could open a path toward $66,000, followed by the late-July swing area near $67,000.
The lower Bollinger Band sits at $62,440, creating a broader support zone between $62,400 and $62,700. A daily close below that area would weaken the range structure and expose $61,000, followed by the June and July lows near $58,000.
Chaikin Money Flow was at minus 0.05 on the daily chart. The reading indicates that capital flows remain slightly negative and offers little evidence of sustained accumulation despite Bitcoin’s rebound.
The 4-hour chart presents a firmer short-term setup. Bitcoin remains above the Supertrend support at $63,466, while the Awesome Oscillator is positive at 951.
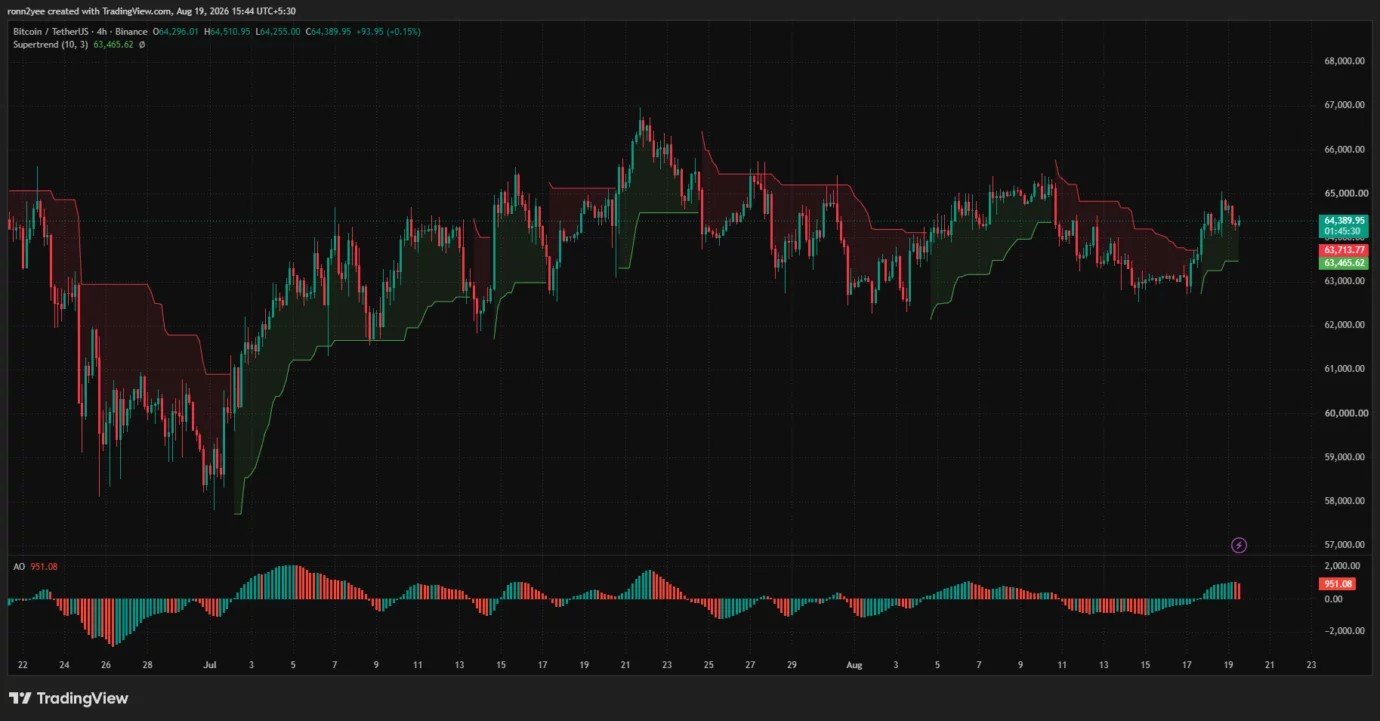
Recent red bars on the Awesome Oscillator show that bullish momentum is slowing after the advance from $62,700. Buyers would need to defend the $63,450–$64,000 region to preserve the short-term recovery.
Liquidation levels could determine the next move
CoinGlass’ one-week liquidation heatmap shows several concentrations of leveraged positions surrounding Bitcoin’s current price.
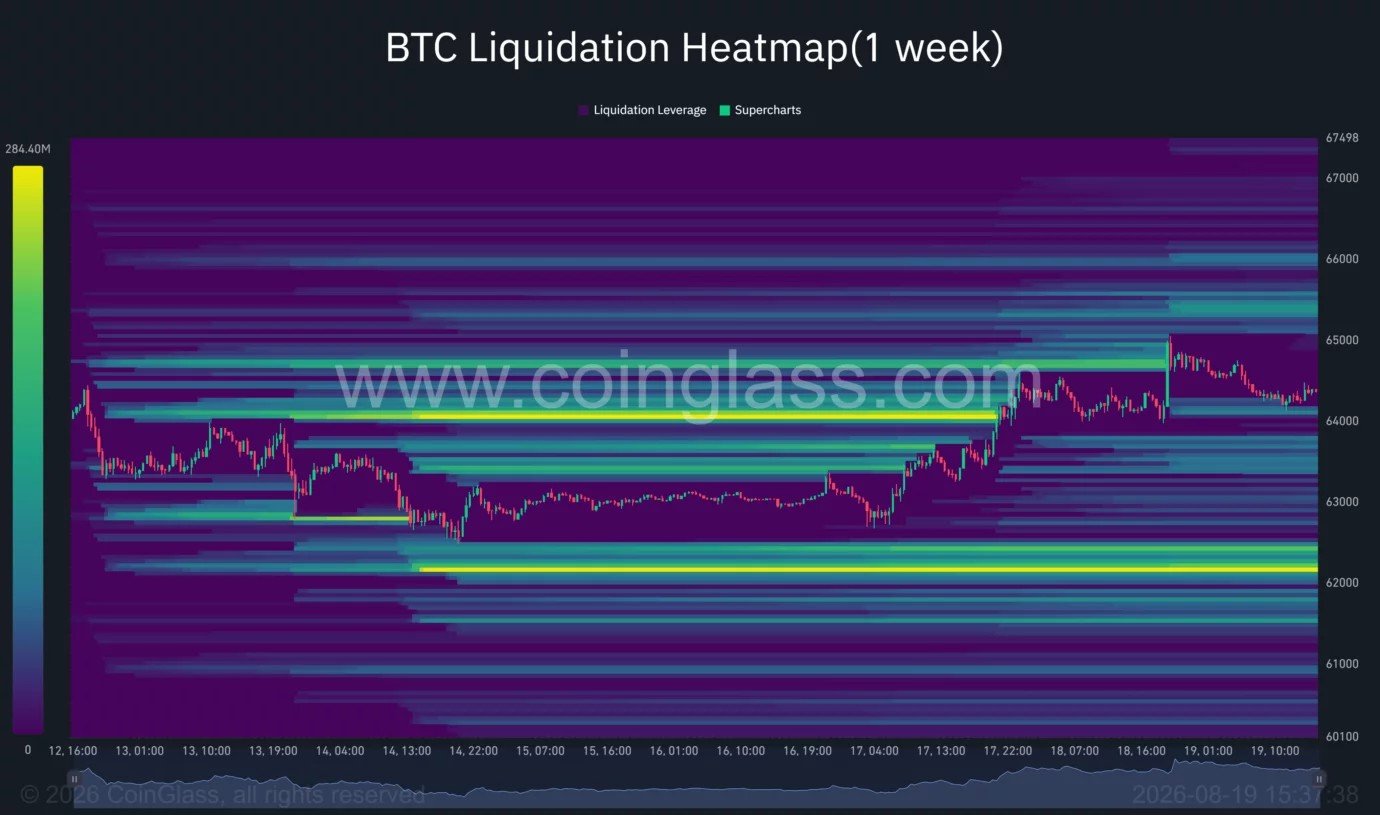
The closest overhead liquidity appears between approximately $65,300 and $65,600, with another cluster around $66,000. A move through $65,400 could trigger short liquidations and accelerate the price toward the second cluster.
The strongest nearby downside concentration sits around $62,200. Additional liquidity is visible between $63,400 and $64,000, making that region a possible target if Bitcoin loses its current 4-hour support.
Liquidation heatmaps identify areas where leveraged positions may be closed, but they do not determine which price level will be reached first. Bitcoin’s position between large clusters on both sides supports Snyder’s view that the market remains compressed.
Fed minutes remain the next US market catalyst
Bitcoin’s retreat also followed a broader pullback in U.S. risk assets. LSEG data cited by Barron’s placed $BTC near $64,306 as rising global bond yields and Middle East tensions weighed on markets.
Treasury yields eased on Wednesday after the previous session’s global bond selloff, with the U.S. 10-year yield around 4.686%. Brent crude remained above $91 as renewed U.S.-Iran tensions maintained concerns about energy-driven inflation.
U.S. investors are now waiting for minutes from the Federal Reserve’s July meeting. The release could provide more information on how officials view inflation and the path of interest rates.
A softer policy signal, improving ETF flows, and a close above $65,400 would strengthen Bitcoin’s breakout case. Renewed pressure on bonds and a loss of $64,000 would instead shift attention toward $62,500 and the large liquidation cluster near $62,200.