
A short-term recovery is underway in crypto markets, but the Bitcoin price remains trapped beneath key moving averages on the daily chart. The divergence between bullish intraday momentum and unresolved structural damage defines the current outlook as of July 6, 2026.
Key takeaways
- Bitcoin traded at $64,330 on July 6, 2026, above the 20-day EMA but still below both the 50-day and 200-day EMAs.
- The Fear & Greed Index sits at 24, deep in Extreme Fear, signaling broad market skepticism about the current bounce.
- Strategy executed its largest-ever Bitcoin sale of $216 million, testing whether underlying buyer demand can absorb the supply.
- The $65,700–$65,800 resistance zone is the critical level separating genuine trend recovery from a lower-high formation.
- Daily ATR of $2,385 signals elevated volatility, making tight stops risky in the current environment.
What the Daily Chart Reveals About Current Price Action
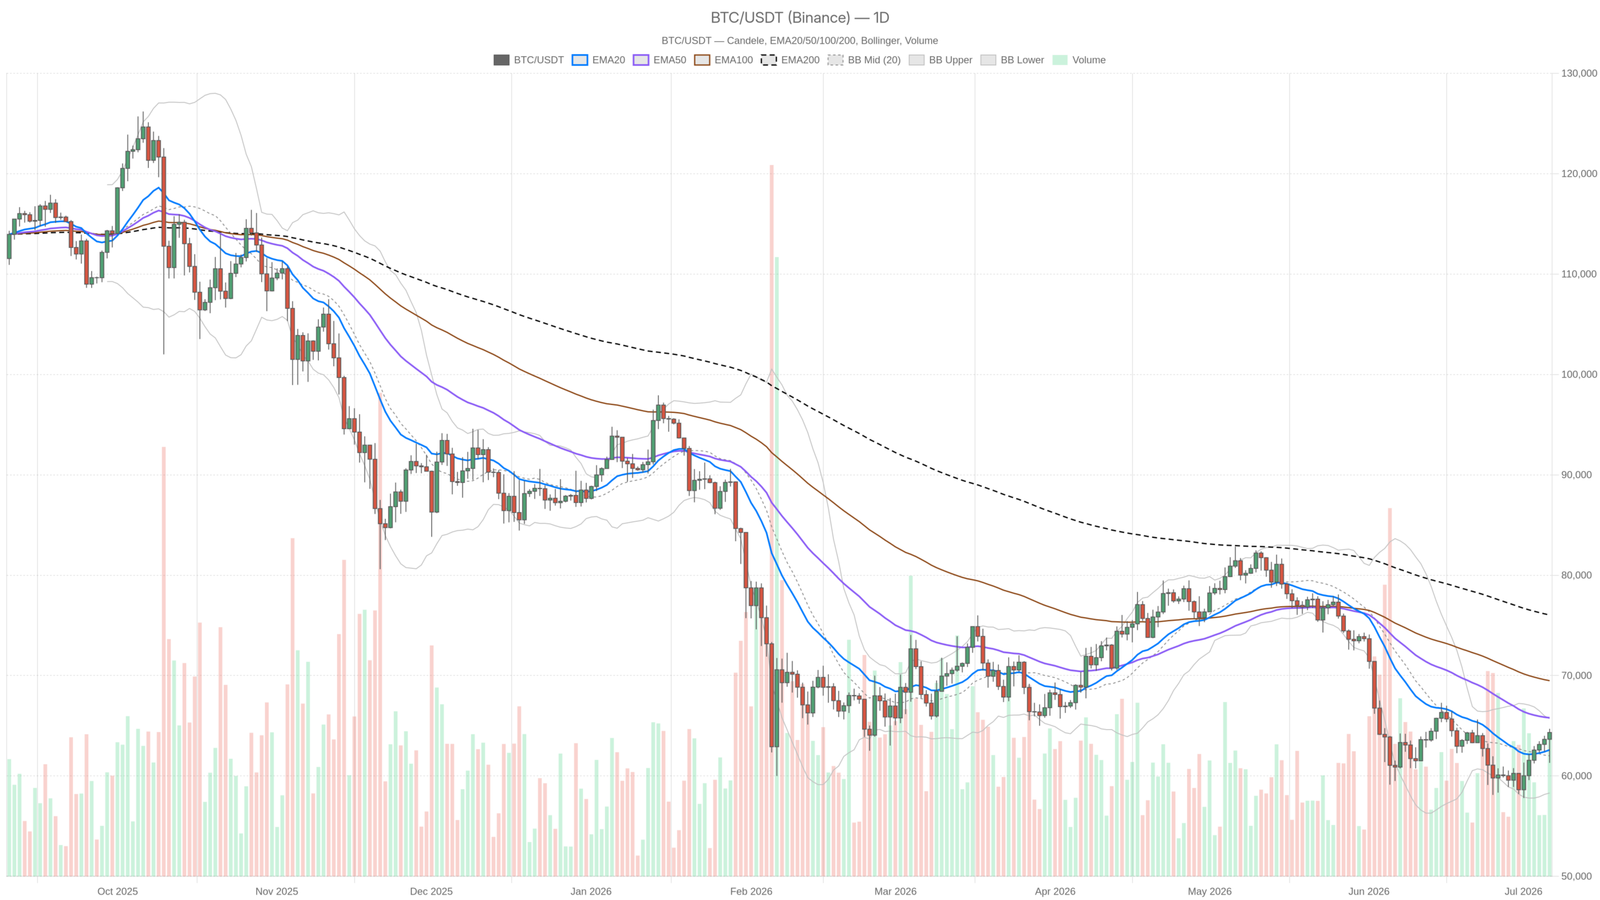
The daily chart shows Bitcoin in recovery mode rather than a confirmed uptrend, with price wedged between the 20-day EMA as support and the 50-day EMA as resistance. The close at $64,330 places price above the 20-day EMA at $62,594, signaling that the short-to-medium trend has tentatively turned supportive. However, the 50-day EMA at $65,794 sits just overhead, and until Bitcoin reclaims that level, any rally remains confined between two competing moving averages. The 200-day EMA at $76,033 is so far removed that it functions less as a target and more as a reminder of lost ground.
The daily RSI at 54.19 is neutral — neither overbought nor oversold — confirming a market in recovery, not in trend. Yet the MACD tells a more nuanced story: the line at -931.51 remains negative, meaning the broader momentum structure is still bearish. The histogram has flipped positive at +747.45, and the MACD line has crossed back above its signal at -1,678.95. That is a classic early-cycle recovery signal, but it requires follow-through to carry weight. Right now it represents an encouraging sign, not a confirmation.
Bollinger Bands frame the picture with the mid-band at $62,006, the upper band at $65,711, and the lower band at $58,301. Bitcoin is pressing toward the upper band — bullish behavior on its own — but the upper band nearly coincides with the 50-day EMA at $65,794. This creates a dense resistance cluster between $65,711 and $65,794. The daily ATR of $2,385 means swings of that magnitude are entirely normal, so volatility in either direction is fully baked into the current environment. Daily pivot support rests at $62,191 with resistance at $65,584, neatly bracketing the range.
Intraday Structure Shows Genuine Bullish Momentum
Short-term momentum is genuinely bullish, with Bitcoin trading above all key EMAs on both the 1-hour and 15-minute timeframes. On the 1-hour chart, price at $64,314 sits above the 20-hour EMA at $63,377, the 50-hour at $63,043, and the 200-hour at $61,909. That full EMA stack alignment is a legitimate short-term bullish signal — every relevant horizon on this timeframe points in the same direction. The 1H RSI at 65.48 is elevated but not yet at levels that historically trigger mean reversion.
The 1H MACD reinforces this outlook: the line at 305.43 sits above the signal at 127.97, with a histogram of 177.47 — momentum is building, not fading. Meanwhile, the 15-minute chart echoes the same structure, with price above all three EMAs and an RSI of 66.06. One slight caution: the 15-minute MACD histogram has compressed to just 22.34, down from higher readings. That is not a reversal signal, but it suggests the immediate sprint may be losing a step. The 15-minute Bollinger upper band at $64,406 and the 1-hour upper band at $64,634 both sit close to current price, creating a short-term ceiling that aligns with the daily R1 at $65,584.
Strategy’s $216 Million Sale Tests Market Conviction
That said, a significant test emerged today: Strategy executed its largest-ever Bitcoin sale, shedding $216 million worth of $BTC, according to Fortune. For a company long synonymous with aggressive accumulation, this is an unusual move — and the market’s reaction will reveal whether underlying demand is strong enough to absorb the supply. If price holds above $63,000–$63,500 despite that kind of selling pressure, genuine buyer conviction would be difficult to dismiss. If it cannot, the intraday bullish setup begins to look more fragile.
Meanwhile, $BTC dominance at 55.95% and a total crypto market cap of roughly $2.31 trillion, per CoinGecko, suggest Bitcoin continues to act as the market’s center of gravity. Altcoins are not running — capital is consolidating in $BTC, which is typical of risk-off or early-recovery environments. The macro backdrop adds another layer: Bloomberg reports that Trump’s proposed Bitcoin Strategic Reserve is hitting bureaucratic turf wars between government departments. Trump’s own comment about becoming “a big crypto guy,” per CNBC, gave Bitcoin a short-term bounce, explaining the intraday momentum without resolving the underlying structural questions.
Bullish and Bearish Scenarios From Current Levels
On the one hand, the bullish case is straightforward. The Bitcoin price clears the $65,584–$65,794 resistance cluster on a daily close, the 50-day EMA flips to support, and the daily MACD histogram continues expanding into positive territory. The next meaningful resistance zone would then sit somewhere in the $68,000–$70,000 area based on prior price structure. What would kill this scenario is a rejection at $65,700 followed by a break below the $63,000–$63,500 short-term support shelf — that would confirm the resistance held and likely shake out the intraday longs.
On the other hand, the bearish case does not require a dramatic catalyst. If the 50-day EMA at $65,794 acts as a ceiling and political noise around the Bitcoin reserve continues generating headline risk, price could roll back toward the daily pivot at $63,445 or the S1 at $62,191. A breach of $62,000 would put the lower Bollinger Band at $58,301 back on the table, and with an ATR of $2,385, a move of that magnitude in a stressed session is entirely plausible. A clean daily close above $66,000, particularly on volume, would invalidate the bearish case by suggesting overhead supply has been absorbed.
Positioning in an Ambiguous Market
Bitcoin is in a genuinely ambiguous position where short-term momentum clashes with a neutral daily regime and extreme fear sentiment. The intraday structure is real — this is not a fake bounce judging by the hourly readings. However, the daily regime remains classified as neutral, the Fear & Greed Index is screaming caution at 24, and Strategy’s record sale introduces fresh supply pressure. The macro political story — a reserve proposal becoming an internal government power struggle — adds an unpredictable overlay that technical analysis cannot price cleanly.
Ultimately, for traders, the $65,700–$65,800 band is the level that separates genuine trend recovery from a lower-high formation. With elevated volatility and a daily ATR above $2,385, this is not an environment where tight stops survive easily. The market is asking for patience and flexibility — not conviction based on a single timeframe reading. Whatever happens in the next session will likely reveal far more than the current indicators can.
FAQ
Where does Bitcoin currently trade and what support level matters most?
As of July 6, 2026, Bitcoin trades at $64,330. The key short-term support sits between $63,000 and $63,500, with daily pivot support at $63,445 and S1 at $62,191. A breach below $62,000 would expose the lower Bollinger Band at $58,301.
What resistance levels are most critical for Bitcoin right now?
The critical resistance cluster lies between $65,584 (daily R1) and $65,794 (50-day EMA), reinforced by the daily Bollinger upper band at $65,711. A clean daily close above this zone would signal a trend recovery, opening the path toward $68,000–$70,000 based on prior price structure.
Why did Strategy sell $216 million in Bitcoin?
Fortune reported that Strategy executed its largest-ever Bitcoin sale on July 6, 2026, shedding $216 million worth of $BTC. The reasons behind the sale were not detailed, but the move is notable because Strategy has long been associated with aggressive Bitcoin accumulation rather than distribution.
Disclaimer: This article is for informational purposes only and does not constitute financial advice, an investment recommendation, or a solicitation to buy or sell any financial instrument or cryptocurrency. The analysis provided is not indicative of future results. Investing in crypto assets and financial markets carries a high risk of capital loss. Always do your own research (DYOR) and consult a qualified financial advisor before making any decision.
Article produced with the assistance of artificial intelligence and reviewed by the editorial team.