
Bitcoin $BTC$63,791.91 is up nearly 10% for the month and could push even higher toward levels above $70,000 that have capped gains in recent months.
That’s the message coming from a popular technical indicator called the moving average convergence divergence (MACD) histogram, which oscillates around the zero line to show the direction and strength of the market trend. Crossovers above zero represent bullish shifts in momentum while crossovers below zero suggest otherwise.
The standard settings for the MACD use a 12-day and 26-day average, along with a 9-day signal line. However, these default parameters often generate short-term flip-flops and noise. To filter that out, many traders switch to longer parameters, such as the 50-day, 100-day, and 9-day settings.
This longer, smoother version of the MACD histogram has now crossed above zero, flashing a bullish shift in momentum. In plain terms, this means the longer-term momentum is turning positive. It suggests bitcoin’s recent gains could continue rather than fizzle out quickly. As of this writing, bitcoin is trading just above $64,000.
Traders typically do not rely on a single indicator to determine market trends. But this particular MACD has proved reliable as a standalone gauge through the price crash from the record high of $126,000. Since October, negative crossovers have reliably marked the start of steeper declines, while positive crossovers have preceded meaningful recovery rallies – including the December–January bounce and the February–May bounce.
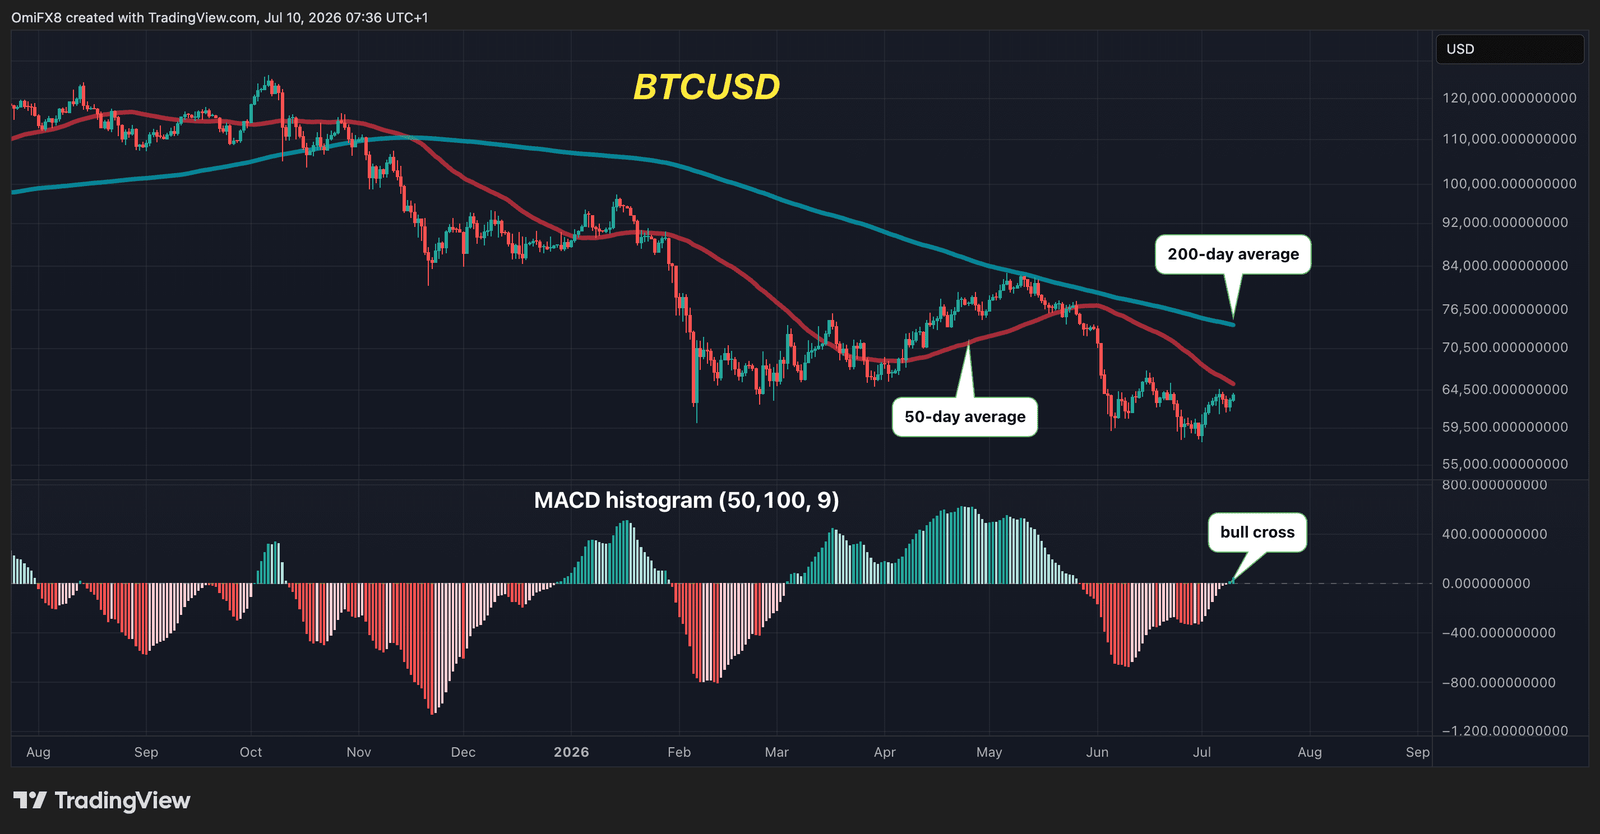
The latest bullish crossover therefore points to a notable bounce ahead, though not necessarily the start of a full-blown new uptrend. That bigger move would need more confirmation, which is why the key resistance levels below are now in focus.
Key levels ahead
The first level to watch is the 50-day simple moving average, currently around $65,434. This is simply the average bitcoin price over the past 50 days (roughly two months).
Traders in both crypto and traditional markets watch this line closely to gauge near-term momentum. A clear move above it is often seen as a sign that upside strength is building.
The second key level is $67,292, which was the mid-June high. This is where bitcoin staged a brief recovery from early June lows near $60,000, only for sellers to step in aggressively. That resistance turned the price lower again. Breaking above $67,292 would be another win for buyers, showing they have overcome the previous area of strong selling pressure.