
Bitcoin has reclaimed $77,000 after a four-hour bullish market structure shift, putting the previous weekly high near $80,430 in focus. However, the setup depends on whether the token’s price can defend the $76,600-$77,100 fair value gap during a pullback.
The Bitstamp four-hour chart shows $BTC near $77,457, above both the FVG and the market structure shift level. That positioning keeps the bullish structure intact while making the next retracement important.
Bitcoin Breaks $77,083 as Four-Hour Structure Turns Bullish
The shift developed after $BTC recovered from its September 15-16 decline below $75,000 and cleared the short-term swing around $77,083. That level marked the MSS shown on the chart and had previously capped the rebound.
By moving above it, $BTC’s price interrupted the earlier sequence of lower highs. Traders interpret that break as evidence that short-term control has shifted back toward buyers. Still, the MSS does not confirm that Bitcoin will automatically reach $80,000.
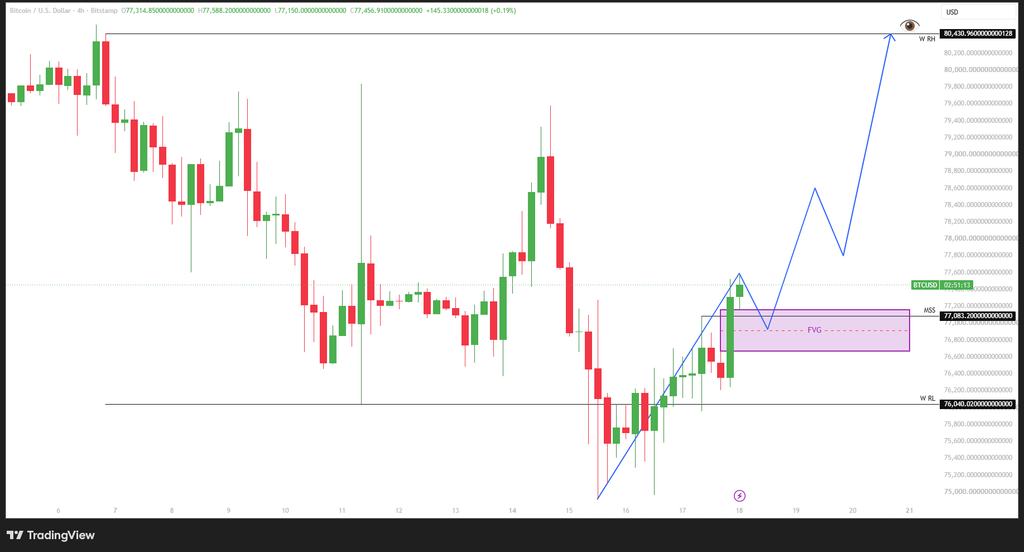
The next test is whether the reclaimed structure can hold when the price retraces. That makes the overlap between the MSS and the nearby fair value gap especially important. Both levels now sit beneath the current price and form the chart’s main confirmation zone.
$76.6K-$77.1K FVG Retest Could Define the Next Move
The fair value gap extends from roughly $76,600 to $77,100 and overlaps the $77,083 MSS. A pullback into that area would test whether former resistance can become support. If $BTC retests the zone and holds above it, the bullish structure would remain intact.
That would keep intermediate resistance near $78,000 and $78,600 in focus. Beyond those levels, the previous weekly high near $80,430 remains the main upside liquidity target visible on the chart. However, the sequence depends on support holding first.
The downside condition is equally clear. A decisive four-hour move back below the FVG and MSS would weaken the setup. Such a breakdown would shift attention toward the previous weekly low near $76,040. That level represents the nearest downside liquidity reference in the current structure.
The chart therefore centers on confirmation, not assumption. Bitcoin has already completed the bullish MSS, but the FVG retest remains the next technical test. Whether that zone becomes support will determine if the structure continues toward $80,430 or weakens back toward the weekly low.
Related: $BTC Dominance Turns Bullish as TOTAL2 Weakens: Is Liquidity Rotating Into Bitcoin?