
However, it has slightly recovered and is now trading above $84,200.
Despite the decline, sustained exchange-traded fund inflows and accumulation by larger holders suggest that underlying demand remains constructive.
Bitcoin also continues to trade well above its major daily moving averages, leaving its broader bullish structure intact.
The immediate test is whether buyers can defend the current area and reclaim resistance at $85,000.
Profit-taking weighs on Bitcoin price
Bitcoin began the week with a 6.7% gain on Monday, climbing to $87,395 before sellers began locking in profits.
Santiment’s Network Realized Profit/Loss metric rose sharply during the rally and reached its highest level since December 12, 2025.
NPL measures the difference between the price at which coins last moved and their value when they are subsequently transferred.
A positive reading generally indicates that holders are moving or selling bitcoin at a profit, while a negative result points to realized losses.
Monday’s spike suggests a significant number of investors used the rally to exit positions or reduce their exposure at higher prices. That additional supply has helped push $BTC lower during the following three sessions.
Institutional demand has remained firm despite the price correction. US spot Bitcoin ETFs attracted $190.65 million in net inflows on Thursday, according to SoSoValue.
The result marked the sixth consecutive day of positive flows beginning last week.
Consistent ETF inflows can support Bitcoin because fund issuers generally purchase $BTC corresponding to new investor demand. This process can absorb some of the supply created by holders taking profits.
The continuation of positive flows during a declining market session may be particularly important.
If inflows continue or accelerate, they could help Bitcoin stabilize and make another attempt to move above $85,000.
A return to significant outflows would remove one of the strongest sources of support behind the recent recovery.
Wallets holding between 100 and 1,000 $BTC have also continued increasing their balances.
According to Santiment, this group has accumulated 113,950 $BTC since July 15. Its combined holdings have risen by 2.22% to approximately 5.24 million $BTC.
At Bitcoin’s current price, the newly accumulated coins would be worth roughly $9.5 billion, although the actual purchase prices may have varied substantially.
Sustained accumulation during Bitcoin’s recovery since mid-August suggests that larger holders have continued adding exposure rather than distributing coins into the rally.
Their buying could help provide support if shorter-term investors continue realizing profits.
Bitcoin maintains bullish technical structure
Bitcoin’s daily chart remains constructive despite its decline towards $84,000.
$BTC is trading comfortably above its 50-day, 100-day, and 200-day exponential moving averages, which are clustered between approximately $73,000 and $76,000.
The 50-day EMA is the highest of the group at $76,096. The 200-day EMA stands near $73,858, while the 100-day EMA is around $73,060.
Trading above all three indicators shows that Bitcoin’s medium- and longer-term trend continues to favor buyers. Their concentration also creates a broad area of potential support if the current correction deepens.
The Relative Strength Index sits around 64 on the daily chart.
That reading remains above its neutral midpoint but below the conventional overbought threshold of 70, indicating positive momentum without extreme conditions.
The Moving Average Convergence Divergence histogram also remains in positive territory. Although price momentum has slowed, the indicator suggests that the broader upward pressure has not fully reversed.
The first major upside barrier is the former horizontal level near $85,000.
A decisive close above that price would indicate that buyers have absorbed the recent profit-taking and could allow $BTC to challenge the $87,395 high again.
A sustained break beyond that high would restore $100,000 as the next major psychological objective.
On the downside, the current trading region around $83,000 represents the first area where buyers may attempt to stabilize the market.
Failure to hold it could produce a deeper correction toward the 50-day EMA at $76,096.
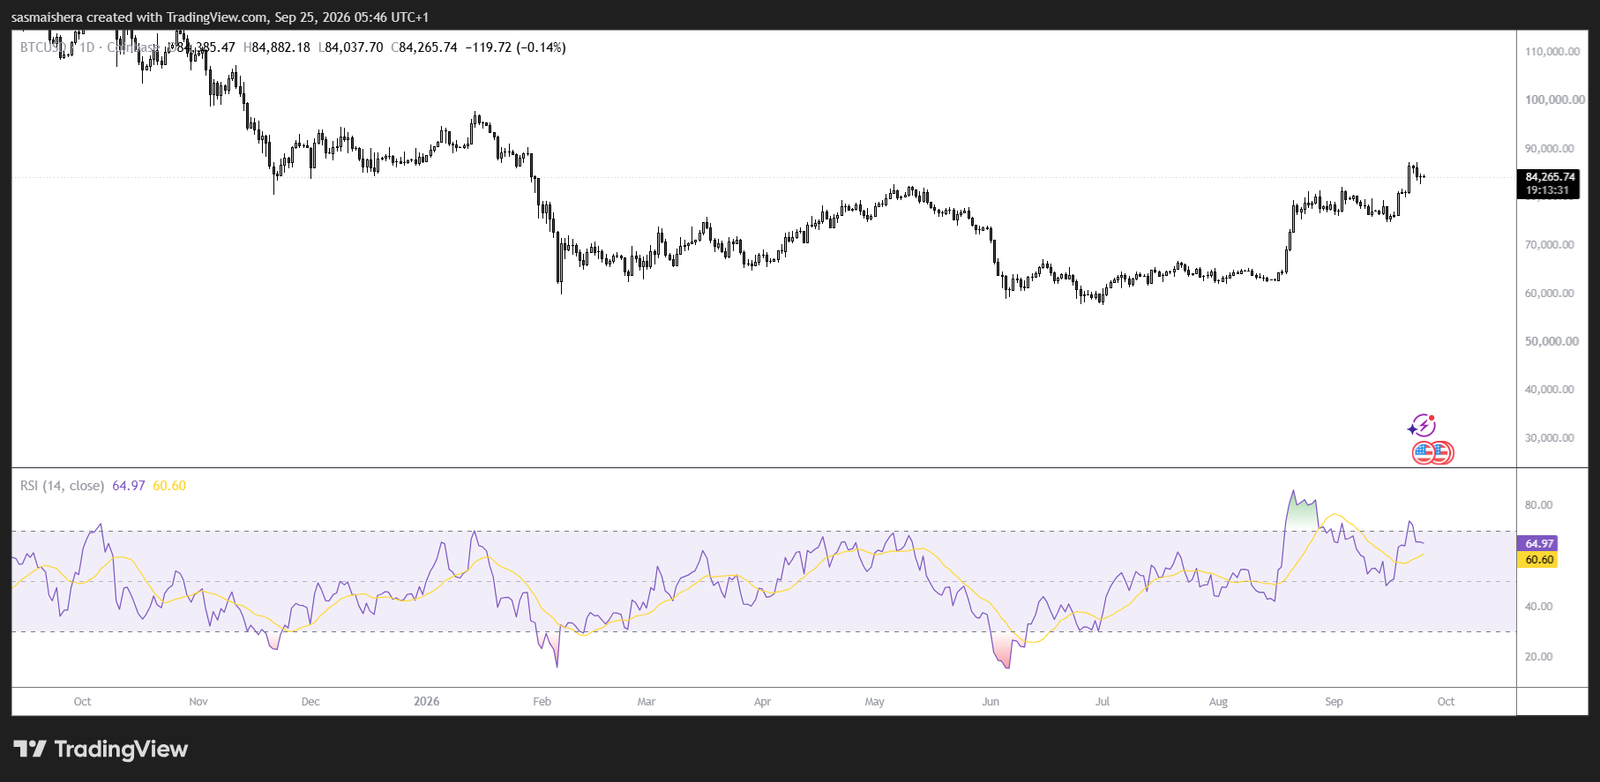
Below that level, the 200-day EMA at $73,858 and the 100-day EMA at $73,060 form additional dynamic support.
The next major horizontal levels sit considerably lower at $66,500 and $62,300, levels traders using the best trading platforms may watch closely if selling pressure deepens.
A retreat into that region would represent a much more extended correction, although the original analysis considers the broader structure bullish while those floors remain intact.
For now, Bitcoin is caught between elevated profit-taking and continued accumulation.
ETF inflows and buying by larger wallets support the recovery thesis, but bulls must reclaim $85,000 to demonstrate that the correction has run its course.