
A sharp short-term move has pushed $BTC to around $71,838 on August 20, 2026, its strongest stretch in months. The Bitcoin crypto rally rests on real catalysts: falling yields, political pressure on Congress, and an end to whale selling.
Key takeaways
- $BTC trades around $71,838 on August 20, 2026, holding above levels last tested in June.
- Total crypto market capitalization rose 7.29% in 24 hours, with Bitcoin dominance at 58.7%, according to CoinGecko.
- Whales added roughly $2.9 billion in net exposure over the past 60 days, according to Bloomberg data.
- Daily RSI at 78.54 and hourly RSI at 82.62 flash overbought warnings.
- Fear & Greed reading stands at 62 (Greed).
Daily Chart: Bulls Are in Control, But the Move Is Stretched
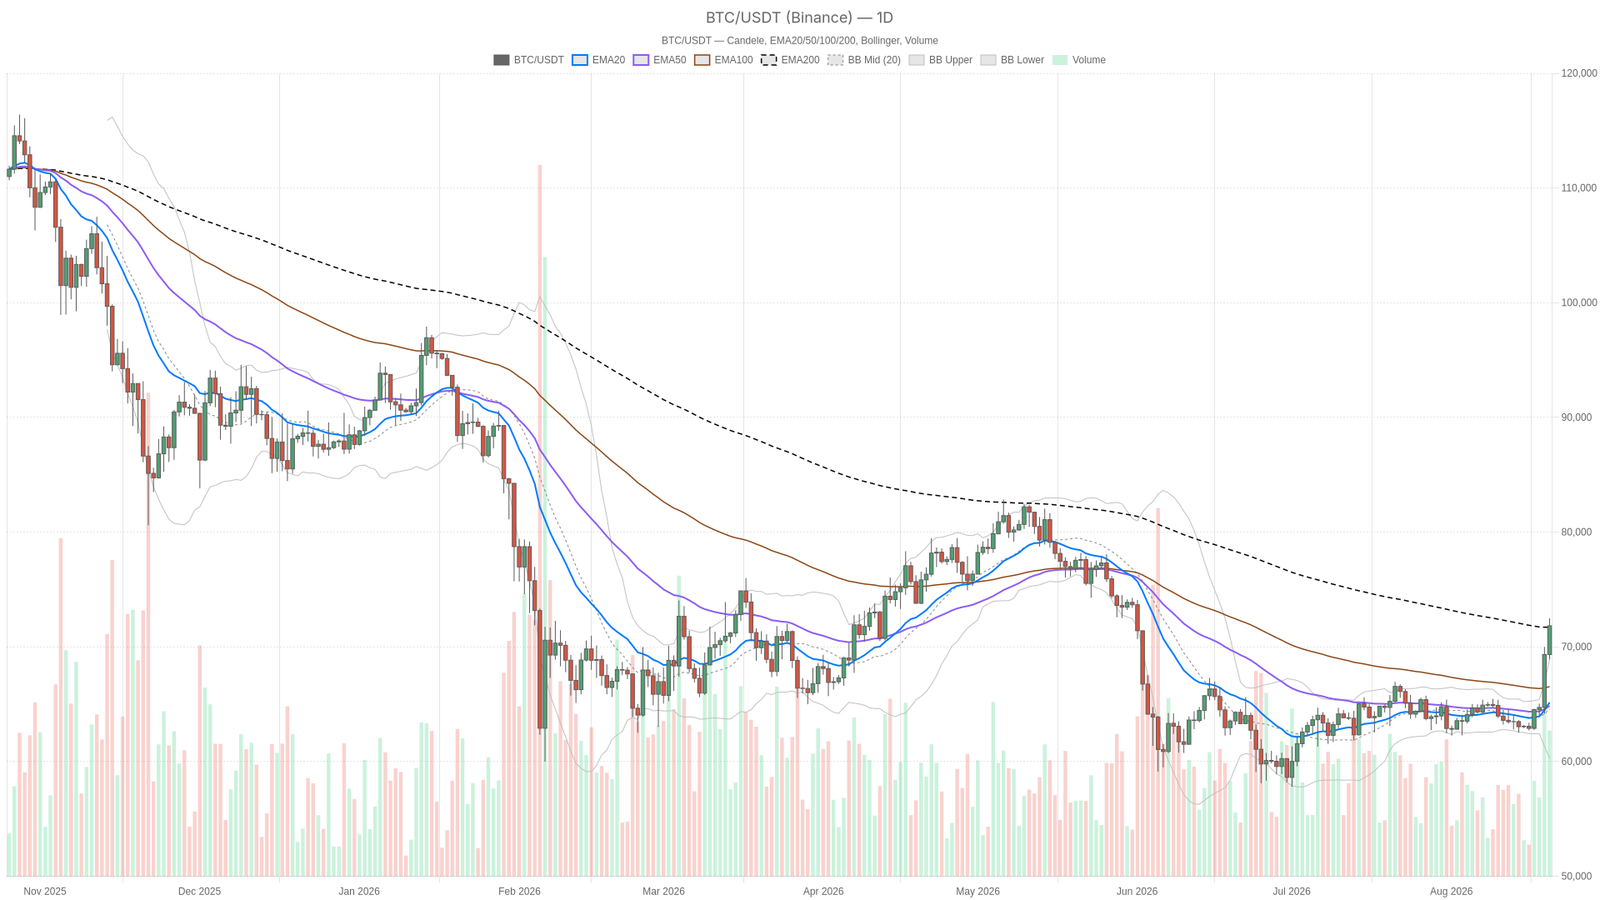
The daily chart is unambiguously bullish but stretched. Price at $71,838 sits essentially on top of the 200 EMA at 71,719.18, having pushed above the 20 EMA (65,163) and the 50 EMA (64,855). Reclaiming the 200 EMA after trading below it typically signals a shift toward a fresh uptrend attempt. The system still tags the daily regime as neutral, likely because price only just crossed that long-term average. However, the price action itself is clearly bullish.
The daily RSI at 78.54 sits deep into overbought territory, and that detail matters. Readings above 70 do not force an immediate reversal, but they show the move has been fast and one-sided. Consequently, pullbacks or consolidation become more likely from here. The MACD tells a more constructive story: the line at 911.5 stands well above the signal at 185, with a histogram of 726.5. That is strong, expanding bullish momentum without any sign of rolling over.
Bollinger Bands add another layer to the overbought read. Price at 71,838 trades above the upper band at 68,887.42, a classic signature of a breakout running hot. ATR14 at 1,569.52 confirms daily ranges have expanded meaningfully. Moreover, volatility-driven whipsaws are more likely near current levels. The daily pivot structure has price above the pivot point at 71,076.74. Resistance at R1 (73,251.26) is the next logical target, while S1 (69,663.48) marks the first line of defense.
Hourly Structure Confirms the Trend, With a Caveat
The hourly chart confirms the uptrend but shows early signs of cooling momentum. The regime reads bullish, and the EMA stack is fully aligned for buyers. The 20 EMA at 69,813.42 sits above the 50 EMA at 67,684.40, which sits above the 200 EMA at 65,111.76. Price above all three, in the correct order, is textbook trend continuation.
Momentum is where the picture gets more interesting. Hourly RSI14 is at 82.62, even more stretched than the daily reading. The MACD remains positive, with the line at 1,443.14 versus the signal at 1,322.88. However, the histogram has narrowed to just 120.25. That is a deceleration signal: price still grinds higher, but the pace is slowing.
Bollinger Bands show price at 71,870 still inside the upper band at 72,303.04. Therefore, there is technically room before the band itself becomes resistance. The hourly pivot has price almost exactly on the pivot point at 71,795.52, with R1 at 72,090.03 and S1 at 71,575.61. That tight range suggests the market is pausing to decide its next move rather than committing hard.
15-Minute Chart: Where the Tension Shows Up
The 15-minute chart shows a short-term momentum stall inside a larger uptrend, not a reversal. The regime is still tagged bullish, and EMAs remain stacked correctly: the 20 EMA at 71,535.28 sits above the 50 EMA at 70,552.89, which sits above the 200 EMA at 67,609.88. However, RSI14 has cooled to 63.44, still constructive but no longer overbought.
Meanwhile, MACD has flipped negative on the histogram at -85.27, with the MACD line (479.06) now below its signal (564.33). That is a short-term momentum stall worth respecting. Price at 71,857.99 sits right on the 15-minute pivot at 71,852.47, with immediate resistance at R1 (72,020.94) and support at S1 (71,689.52). In practice, the higher timeframes want higher prices, while the lower timeframe wants a breather first.
Bullish Case vs. Bearish Case
The bullish case points higher; the bearish case points to a cool-off. If $BTC holds above the 200 EMA near 71,719 and defends the daily pivot at 71,076.74, the path toward R1 at 73,251.26 stays open. This aligns with the backdrop: sinking yields, political tailwinds around the Clarity Act, and whale accumulation reported by Bloomberg. These support a continuation narrative for this Bitcoin crypto move rather than a one-off spike. A Fear & Greed reading of 62 (Greed) also supports this, with risk-on sentiment still short of euphoria.
The bearish case, or more accurately the corrective case, centers on overbought daily and hourly RSI combined with fading 15-minute momentum. If price loses the 15-minute pivot and then the hourly S1 at 71,575.61, a deeper pullback toward the hourly 20 EMA at 69,813 becomes reasonable. It could even reach the daily upper Bollinger Band at 68,887.42, which would now act as support. That kind of pullback would not break the broader uptrend; it would simply be the market digesting an overbought condition.
What would invalidate the bullish case outright is a daily close back below the 200 EMA at 71,719.18 or a break of daily S1 at 69,663.48. That would suggest the reclaim of the long-term average was a failed breakout. Conversely, the bearish case would be invalidated by a reclaim and hold above the 15-minute R1 at 72,020.94 and hourly R1 at 72,090.03. That would require the MACD histogram to flip positive again on the lower timeframe, showing buyers absorbed the overbought reading without a real pullback.
Positioning and Risk
The right posture is to weigh macro strength against stretched short-term indicators. The bitcoin market is showing genuine strength backed by real catalysts, not just chart momentum. However, it is also showing every classic sign of being short-term overextended across multiple timeframes simultaneously. That combination typically means volatility stays elevated in both directions until overbought pressure is worked off, either through consolidation or a sharper pullback.
Daily ATR at 1,569.52 and hourly ATR at 619.80 both point to wide expected ranges. Therefore, whatever happens next is unlikely to be slow or orderly. Anyone tracking this move should weigh macro strength against stretched shorter-term indicators, rather than treating either signal in isolation.
FAQ
Why is Bitcoin rallying now?
The rally is fueled by falling yields, renewed political pressure from Trump on Congress, and a reported end to the whale selling spree. The political push centers on the crypto Clarity Act. Bloomberg data shows whales added roughly $2.9 billion in net exposure over the past 60 days.
Is Bitcoin overbought right now?
Yes, by several measures. The daily RSI is at 78.54 and the hourly RSI is at 82.62, both above the 70 overbought threshold. Price also trades above the daily upper Bollinger Band at 68,887.42.
What levels matter most for the bullish and bearish cases?
The daily 200 EMA at 71,719.18 and the daily pivot at 71,076.74 are key support. Daily R1 at 73,251.26 is the next target. A daily close below the 200 EMA or a break of S1 at 69,663.48 would invalidate the bullish case.
Disclaimer: This article is for informational purposes only and does not constitute financial advice, an investment recommendation, or a solicitation to buy or sell any financial instrument or cryptocurrency. The analysis provided is not indicative of future results. Investing in crypto assets and financial markets carries a high risk of capital loss. Always do your own research (DYOR) and consult a qualified financial advisor before making any decision.
Article produced with the assistance of artificial intelligence and reviewed by the editorial team.