Early August brought renewed optimism across the cryptocurrency sector, and one popular on-chain analyst, Ali Martinez, believes that the Bitcoin ($BTC) bear market might be ‘in final stages.’
Specifically, in an X post published on August 11, the blockchain expert appears to have mapped a trajectory that could take $BTC 181% higher from $63,874 at press time to at least $180,000 by the second half (H2) of 2027.
Martinez appears to have drawn a direct comparison between what he now expects of Bitcoin and the cryptocurrency’s trajectory between the 2023 bullish reversal and the most recent all-time high (ATH) above $125,000 reached in late 2025.
Furthermore, the on-chain analyst appears to have also leaned on a series of technical buy signals he identified on August 7.
Good morning, bulls!
— Ali Charts (@alicharts) August 11, 2026
Bitcoin $BTC is in the final stages of the bear market. https://t.co/2r05AAtr8H pic.twitter.com/GkgQzR96fd
Why this on-chain analyst believes Bitcoin bull market will restart in 2026
Indeed, last Friday, Ali Martinez explained that there was an apparent convergence of indicators hinting at a significant incoming Bitcoin price rally.
To begin with, the expert stated that TD Sequential – a technical analysis tool developed late in the previous century and designed to identify a trend reversal – appeared in the July chart. The very same signal, the analyst added, appeared in 2022 and correctly detected the market bottom.
Another indicator that Bitcoin was nearing the bottom of the current bear market, Martinez stated, came in the form of $BTC price approaching its 50-month simple moving average (SMA) – another phenomenon that historically tended to coincide with cycle lows.
Finally, the blockchain analyst posted that the Chande Momentum Oscillator reset to -71. A similar signal flashed in June when the world’s premier cryptocurrency plummeted toward $57,000, further strengthening the notion that a market bottom is near.
4/5 Meanwhile, the Chande Momentum Oscillator has reset to -71.
— Ali Charts (@alicharts) August 7, 2026
The last time it reached this level was in June, when Bitcoin fell toward $57,000. Historically, this reading has often coincided with major bottoms. pic.twitter.com/UFQRKmVT9x
Still, Ali Martinez warned that Bitcoin could still consolidate between $60,000 and $67,000 rather than soaring – and, indeed, the expert noted on multiple occasions in 2026 that the $BTC bottom is likely in early October – though he emphasized that technical analysis strongly hints at a rally.
2026 Bitcoin price chart
Meanwhile, Bitcoin has been trading with significant volatility within the last 30 days, though its price – with a 0.36% monthly decline – remained ultimately flat within the timeframe.
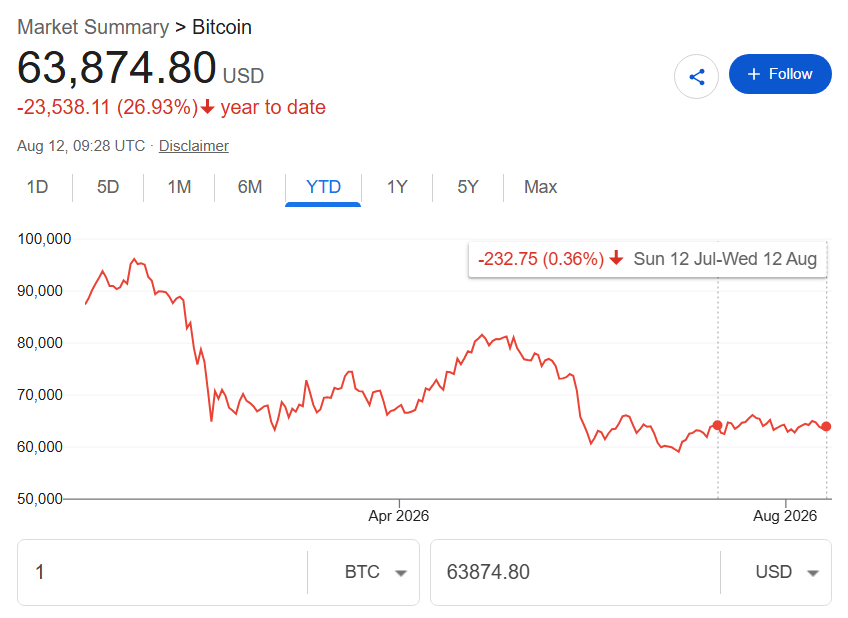
Nonetheless, the fact that the world’s premier cryptocurrency remains 26.93% in the red year-to-date (YTD) and that it has been keeping a relatively steady price since early June does lend credence to the notion that the market is in an accumulation phase ahead of an explosive rally.
Featured image via Shutterstock