
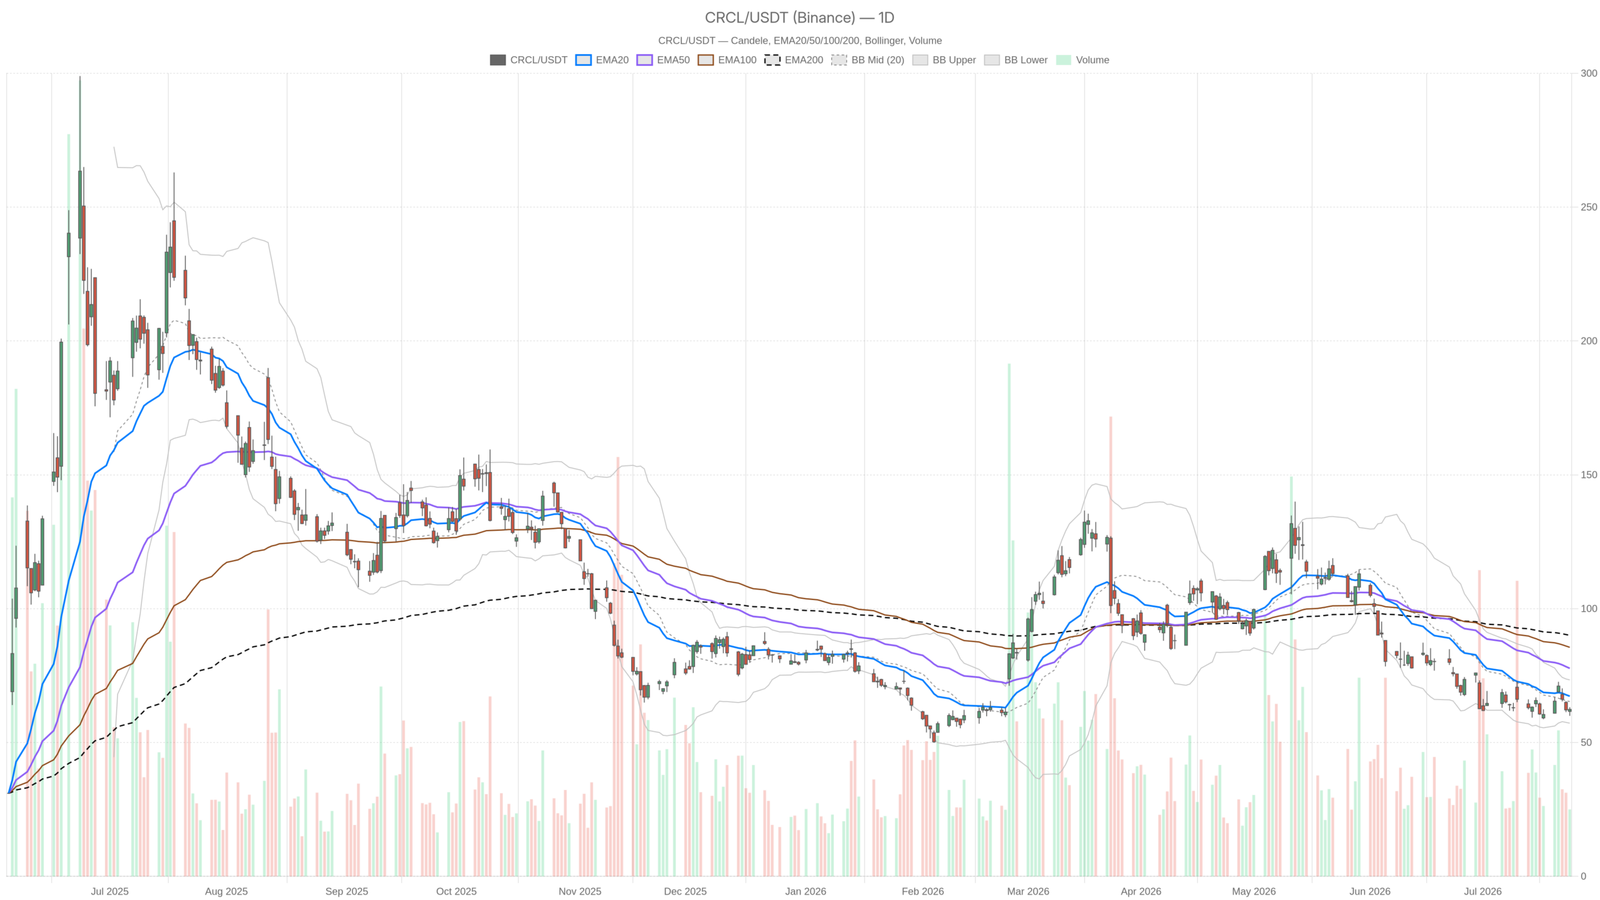
Circle Stock (CRCL) closed at $62.36 on July 24, trapped below a cascade of declining moving averages across all key timeframes. The technical structure remains firmly bearish, though short-term charts hint at stabilization rather than an immediate breakdown.
Key takeaways
- CRCL closed at $62.36, well below its 20-day EMA at $67.30, 50-day EMA at $77.71, and 200-day EMA at $90.05 — a textbook bearish cascade.
- Daily RSI at 41.2 has not reached oversold territory, leaving room for further downside before buyers gain a technical excuse to step in.
- Ark Invest purchased $14 million in Circle Stock, while President Heath Tarbert sold over 360,000 shares totaling more than $30 million since the IPO.
- Bearish targets sit at $60.49 (S1 support), then the lower Bollinger Band at $57.21.
- Bulls need a daily close above the 20-day EMA at $67.30 with volume to begin challenging the bearish structure.
Circle Stock Under Pressure as Bearish Structure Persists
Circle Stock remains locked in a textbook bearish structure across all meaningful timeframes. CRCL trades well below a stack of declining exponential moving averages that collectively leave little room for a bullish interpretation.
The main bias is unambiguously to the downside. What short-term price action offers is stabilization — not a reversal. Meanwhile, the weight of evidence across daily and hourly charts does nothing to challenge this reading. Traders looking for a trend change will find no confirmation here yet.
Daily Timeframe — Bearish Regime Fully Intact
The daily chart confirms an unambiguous downtrend. CRCL sits beneath its 20-day EMA at $67.30, its 50-day EMA at $77.71, and its 200-day EMA at $90.05. That cascading alignment — price below all three, with each EMA below the next — signals sustained selling pressure measured in weeks, not days.
The RSI at 41.2 reinforces this view. The reading sits in the lower half of the range without touching oversold territory. There is still room to fall. Meanwhile, the MACD line at -4.72 remains below the signal line at -5.84. However, the histogram has turned positive at 1.12 — a small but notable detail suggesting the pace of selling may be decelerating.
Bollinger Bands place the midline at $65.30. The lower band sits at $57.21 and the upper at $73.39. Price currently floats between the midline and the lower band — consistent with a stock in a downtrend. The daily ATR of $4.92 indicates meaningful intraday volatility. Traders should expect wide swings within this range.
Pivot analysis puts the daily pivot point at $61.83, with resistance at $63.71 and support at $60.49. Friday’s close at $62.36 is marginally above the pivot. That is a thin positive, but not enough to alter the structural outlook.
Hourly View — Bearish, But Selling Pressure May Be Decelerating
The hourly chart reinforces the bearish outlook without adding new conviction to the sell case. Price at $62.41 sits below the 1H EMA20 at $63.65, EMA50 at $64.46, and EMA200 at $71.16. The alignment mirrors the daily setup on a smaller scale. No hourly structure contradicts the daily bear case.
Still, the 1H RSI at 42.01 does show a modest detail worth noting. It hovers near the same subdued level as the daily reading. This suggests accumulated selling pressure rather than a fresh breakdown. The 1H MACD is modestly negative — line at -0.99 versus signal at -0.85 — with a histogram of -0.14. In contrast to the daily chart, the hourly selling momentum is not accelerating.
The 1H Bollinger midline sits at $63.90, with price trading below it. The 1H ATR of $1.42 reflects contained intraday movement. Resistance at the hourly R1 of $62.63 is the immediate ceiling. Support at $62.08 is the first line of defense for bulls on a short-term basis.
15-Minute Chart — Neutral Consolidation, No Clear Signal
The 15-minute chart shifts to neutral — an important divergence from the higher timeframes. RSI on the 15m stands at 48.97, close to the midpoint. The MACD histogram is a slight positive at 0.02, with the line and signal nearly flat at -0.05 and -0.07 respectively.
At this granularity, CRCL is not breaking down further. But it is also not recovering with any conviction. Price is essentially pinned near $62.41, consolidating in a tight Bollinger Band range of $62.10 to $62.91. The 15m EMA200 at $64.27 sits well above current price, confirming the broader downtrend even within this short window.
For traders looking for entry timing, the 15m picture says “wait” rather than “act.” The setup is not clean enough for confident positioning in either direction on the short-term.
News Flow — Institutional Buying Meets Insider Selling
Conflicting fundamental signals are emerging around Circle Stock. Cathie Wood’s Ark Invest purchased another $14 million worth of shares, adding to existing positions across three ETFs. That kind of institutional conviction from a high-profile growth investor is not something to dismiss lightly. It suggests at least one major player sees long-term value below current levels.
On the other hand, Circle’s President Heath Tarbert sold over 360,000 shares — totaling more than $30 million in CRCL since the IPO. The filings describe the sales as routine, and SEC-planned sales often are. Nevertheless, the optics of significant insider supply hitting the market while the stock trades below every major moving average is a headwind that cannot be ignored.
Meanwhile, Circle CEO Jeremy Allaire publicly pointed to record growth expectations for the stablecoin market. The narrative is growth-oriented. However, Motley Fool’s framing raises a pointed question: whether CRCL is actually the best vehicle to capture that upside. The gap between the macro stablecoin story and the stock’s technical weakness suggests the market is not yet pricing in that optimism.
Bullish Scenario — What Circle Stock Needs to Recover
Bulls would need CRCL to reclaim the daily EMA20 at $67.30 with volume to signal even a short-term mean-reversion trade. That level is the first meaningful structural threshold. A close above it could attract momentum buyers who have so far stayed away.
The positive MACD histogram on the daily — even if small — is one early ingredient for a potential recovery. If the 1H momentum can turn cleanly positive and price clears the R1 at $62.63, then challenges toward $63.71 and beyond become realistic. Continued institutional accumulation from firms like Ark Invest could also act as a floor, slowing further deterioration and eventually shifting sentiment.
Bearish Scenario — The Path of Least Resistance
The bearish path requires far less effort from the market. A failure to hold above the daily pivot at $61.83 reopens the path toward S1 support at $60.49. Below that, the lower Bollinger Band at $57.21 becomes the next logical target.
Given that all three daily EMAs are pointing lower, the structural case for further downside remains credible. The RSI has not yet reached oversold territory, leaving the door open for additional weakness. Insider selling pressure adds to this risk. If Tarbert’s sales continue or other insiders follow suit, the supply overhang could weigh on any attempted recovery. At the same time, if the stablecoin growth narrative fails to translate into concrete earnings momentum, the valuation premium that once justified higher prices may continue to erode.
Positioning and Final Assessment
Circle Stock remains a bearish proposition until proven otherwise. The daily and hourly regimes are both bearish. The 15-minute chart offers a momentary pause — not a trend change. With an ATR of $4.92 on the daily, volatility is high enough to punish poorly-timed entries on both sides.
The key question is whether institutional buyers like Ark Invest can absorb enough supply to prevent another leg lower. Until CRCL reclaims its EMA20 on a daily close, the technical bias remains firmly bearish. Overall, uncertainty is elevated and the risk-reward for aggressive long positioning is unfavorable at this stage. Patience is the most rational posture here.
FAQ
What is the current technical outlook for Circle Stock?
Circle Stock is in a firmly bearish structure on both daily and hourly timeframes. CRCL trades below its 20-day, 50-day, and 200-day EMAs, with the daily RSI at 41.2 — not yet oversold, suggesting further downside remains possible before a meaningful bounce.
What price levels should traders watch for CRCL?
Key resistance sits at the daily EMA20 of $67.30. Support levels include the daily pivot at $61.83, S1 at $60.49, and the lower Bollinger Band at $57.21. On the hourly chart, resistance at $62.63 and support at $62.08 are the immediate short-term thresholds.
Are there conflicting signals in Circle Stock’s fundamental backdrop?
Yes. Ark Invest, led by Cathie Wood, purchased an additional $14 million in Circle Stock, signaling institutional conviction at current levels. However, Circle President Heath Tarbert sold over 360,000 shares totaling more than $30 million since the IPO, creating a supply overhang that weighs on any recovery attempt.
What needs to happen for Circle Stock to turn bullish?
CRCL must reclaim the daily EMA20 at $67.30 on a closing basis with meaningful volume. A positive turn in the 1H momentum combined with a break above hourly R1 at $62.63 would be an early signal of improving conditions. Until then, the technical bias remains bearish.
Disclaimer: This article is for informational purposes only and does not constitute financial advice, an investment recommendation, or a solicitation to buy or sell any financial instrument or cryptocurrency. The analysis provided is not indicative of future results. Investing in crypto assets and financial markets carries a high risk of capital loss. Always do your own research (DYOR) and consult a qualified financial advisor before making any decision.
Article produced with the assistance of artificial intelligence and reviewed by the editorial team.