Arbitrum’s $ARB token has rebounded sharply, but traders now face a test between improving momentum and persistent supply concerns. $ARB trades near $0.1553 after gaining 2.5% today, while its weekly performance remains down 10.40%. The latest recovery has pushed price above major exponential moving averages.
Consequently, short-term momentum has improved as buyers attempt to extend the rebound. However, $ARB still faces important resistance near $0.1600. A successful break could bring higher Fibonacci levels into focus.
$ARB Price Levels Signal a Critical Test
$ARB currently faces immediate resistance around $0.1600, making that level important for the next directional move. Above it, the $0.1771 Fibonacci level represents the next significant hurdle. A stronger rally could then target $0.2057, which marks major Fibonacci resistance.
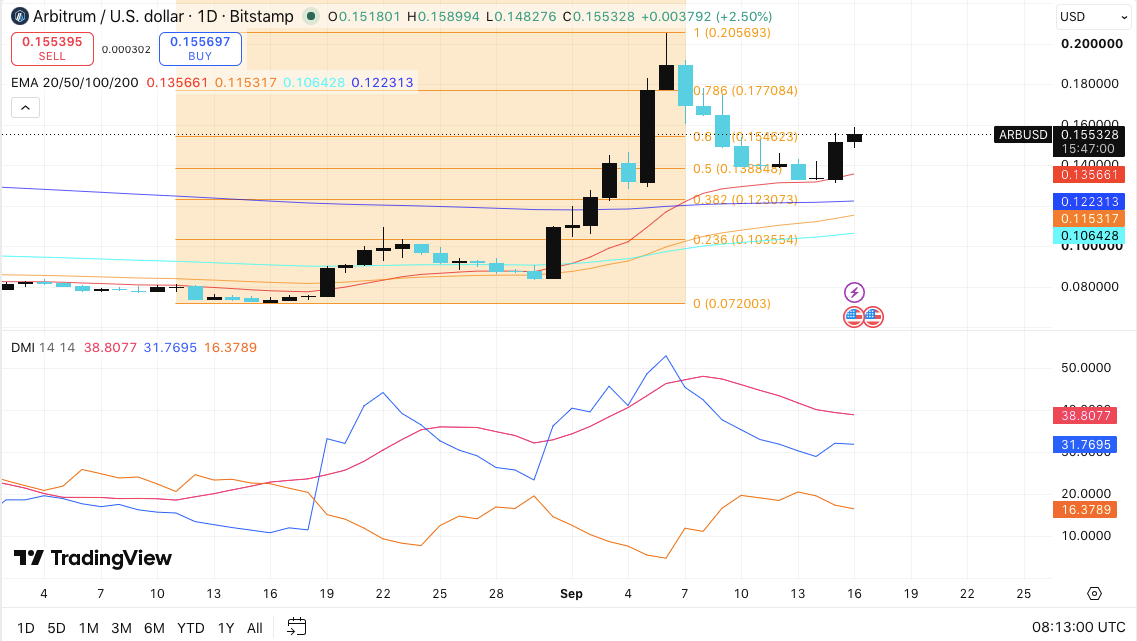
On the downside, $0.1546 provides immediate support through the 0.618 Fibonacci retracement. Below that level, $ARB could revisit $0.1388 near the 0.5 retracement.
Additionally, the 20-day EMA sits around $0.1357. The $0.1231 area combines the 0.382 Fibonacci level with the 200-day EMA.
Related: $XRP Price Prediction: $XRP Holds $1.28 as Clarity Act Defeat Pressures Market
Momentum indicators also favor buyers for now. The ADX stands at 38.8, pointing to a relatively strong trend. Meanwhile, +DI at 31.8 remains well above -DI at 16.4.
Open Interest Shows Renewed Participation
Arbitrum’s derivatives market has experienced several sharp shifts in trader positioning. Open interest climbed from roughly $150 million before reaching nearly $500 million in late August.
That increase coincided with $ARB’s recovery and suggested greater leverage across derivatives markets. However, open interest later declined and reached roughly $80 million during its weakest period.
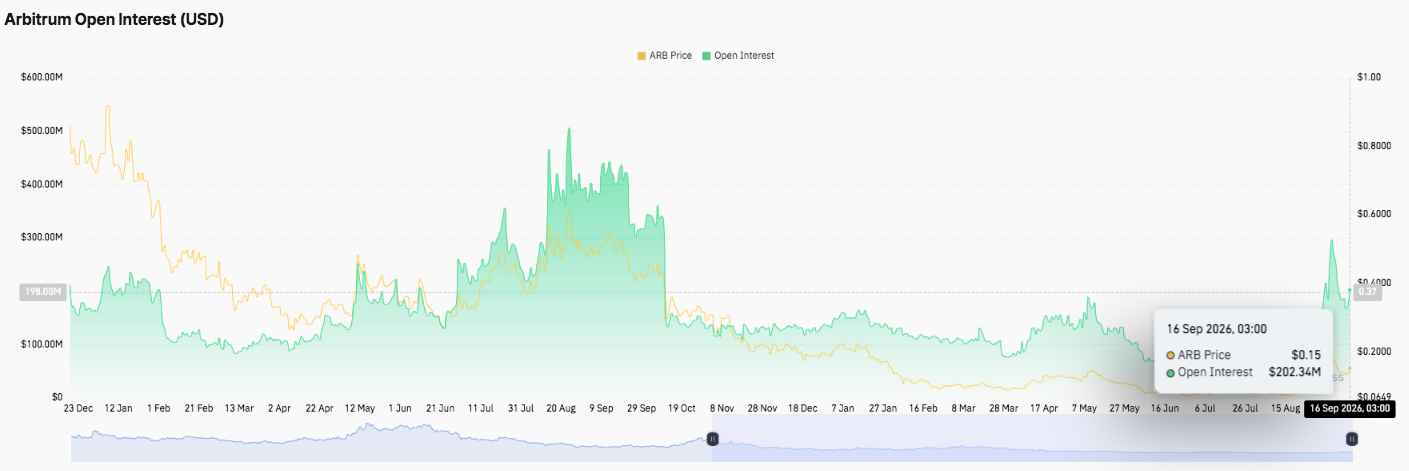
Positioning improved again during April and May before another pullback followed in late May and June. More recently, open interest jumped toward $300 million during mid-September.
It has since eased toward $202 million. Hence, traders remain active, although the latest decline suggests some leverage has already left the market.
Spot Flows Keep Supply Pressure in Focus
$ARB’s spot flows remain dominated by net outflows across much of the tracked period. Significant negative spikes appeared during January, February, May, and August.
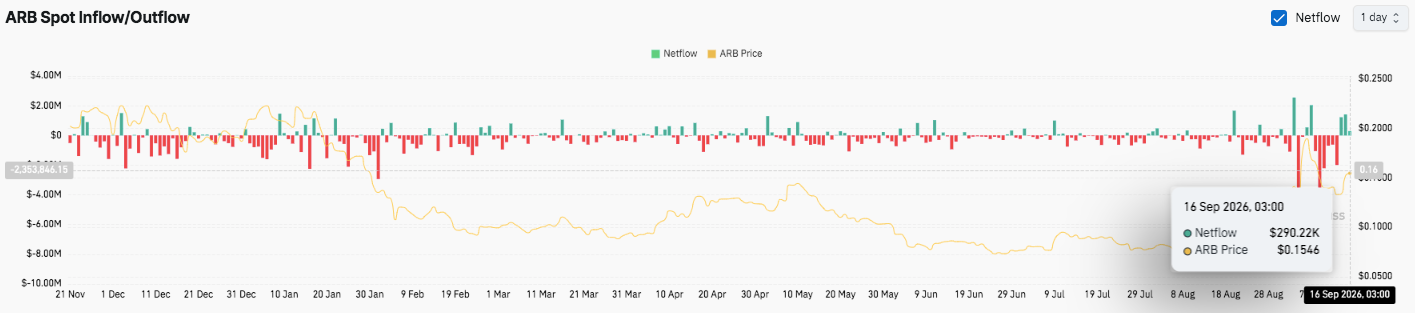
More recently, sharp outflows emerged around mid-September. Such movements can reduce exchange-held supply, although they do not necessarily confirm sustained accumulation.
Related: Bitcoin Price Prediction: BTC Slips Below $76,000 as CLARITY Act Fails in the Senate
The latest reading shows a modest $290,220 net inflow. Therefore, short-term buying activity has appeared despite the broader negative flow pattern.
Standard Chartered Sees Longer-Term Revenue Growth
Standard Chartered analyst Geoff Kendrick views Arbitrum as infrastructure for traditional financial firms entering blockchain markets. Arbitrum collects 10% of net protocol revenue from chains using its technology stack.
HUGE new research note from @StanChart on Arbitrum just now!
— Brendan Ma (@itsbrendanma) September 15, 2026
They forecast 250x increase in the tokenized equity market by 2028 with @Arbitrum at a “unique advantage” with a business model to “help TradFi operators move on-chain”.
Standard Chartered is a major international… pic.twitter.com/eJaABY2bxQ
Robinhood Chain could provide an important revenue test. Kendrick expects Arbitrum to generate about $5 million during September.
He also projects tokenized equities could expand from roughly $3 billion today to $750 billion by 2028. His $ARB projections reach $0.50 this year, $1.50 in 2027, and $3.50 in 2028.
However, $ARB lacks direct revenue rights and a token burn mechanism. Moreover, roughly 92.3% of its 10 billion maximum supply has vested. The final tranche arrives in March 2027, leaving token supply as an important consideration for future $ARB valuation.
Technical Outlook For Arbitrum Price
Key levels remain clearly defined heading into October:
Upside levels: $0.1600 is the immediate hurdle, followed by $0.1771 and $0.2057. A sustained breakout above $0.1600 could open the path toward the higher Fibonacci resistance.
Downside levels: $0.1546 provides immediate support, followed by $0.1388 and $0.1357. A deeper decline could expose the $0.1231 area, where the 0.382 Fibonacci level meets the 200-day EMA.
Resistance ceiling: $0.2057 represents the major Fibonacci resistance that $ARB needs to overcome for a broader upside extension. The $0.1771 level remains the next important confirmation zone.
The technical picture shows $ARB attempting to recover after a prolonged decline. Price has reclaimed its major EMAs, while an ADX reading of 38.8 points to a relatively strong trend. Additionally, +DI remains above -DI, keeping short-term momentum tilted toward buyers.
Will Arbitrum Go Up?
Arbitrum’s price prediction for October hinges on whether buyers can defend $0.1546 and break $0.1600 decisively. A sustained move above that resistance could strengthen the recovery and expose $0.1771.
Moreover, stronger derivatives participation could support the move if open interest continues recovering. However, recent spot flows remain broadly negative, creating a potential headwind for sustained upside.
Related: Pi Network Price Prediction: Can PI Hold Its Rising Channel After a Sell Signal Fires?
Failure to hold $0.1546 could weaken the recovery and expose $ARB to $0.1388. A break below the 20-day EMA around $0.1357 would further weaken the short-term structure.
For now, $ARB sits at a key decision zone. The $0.1600 breakout level and $0.1546 support should define the next major move.