
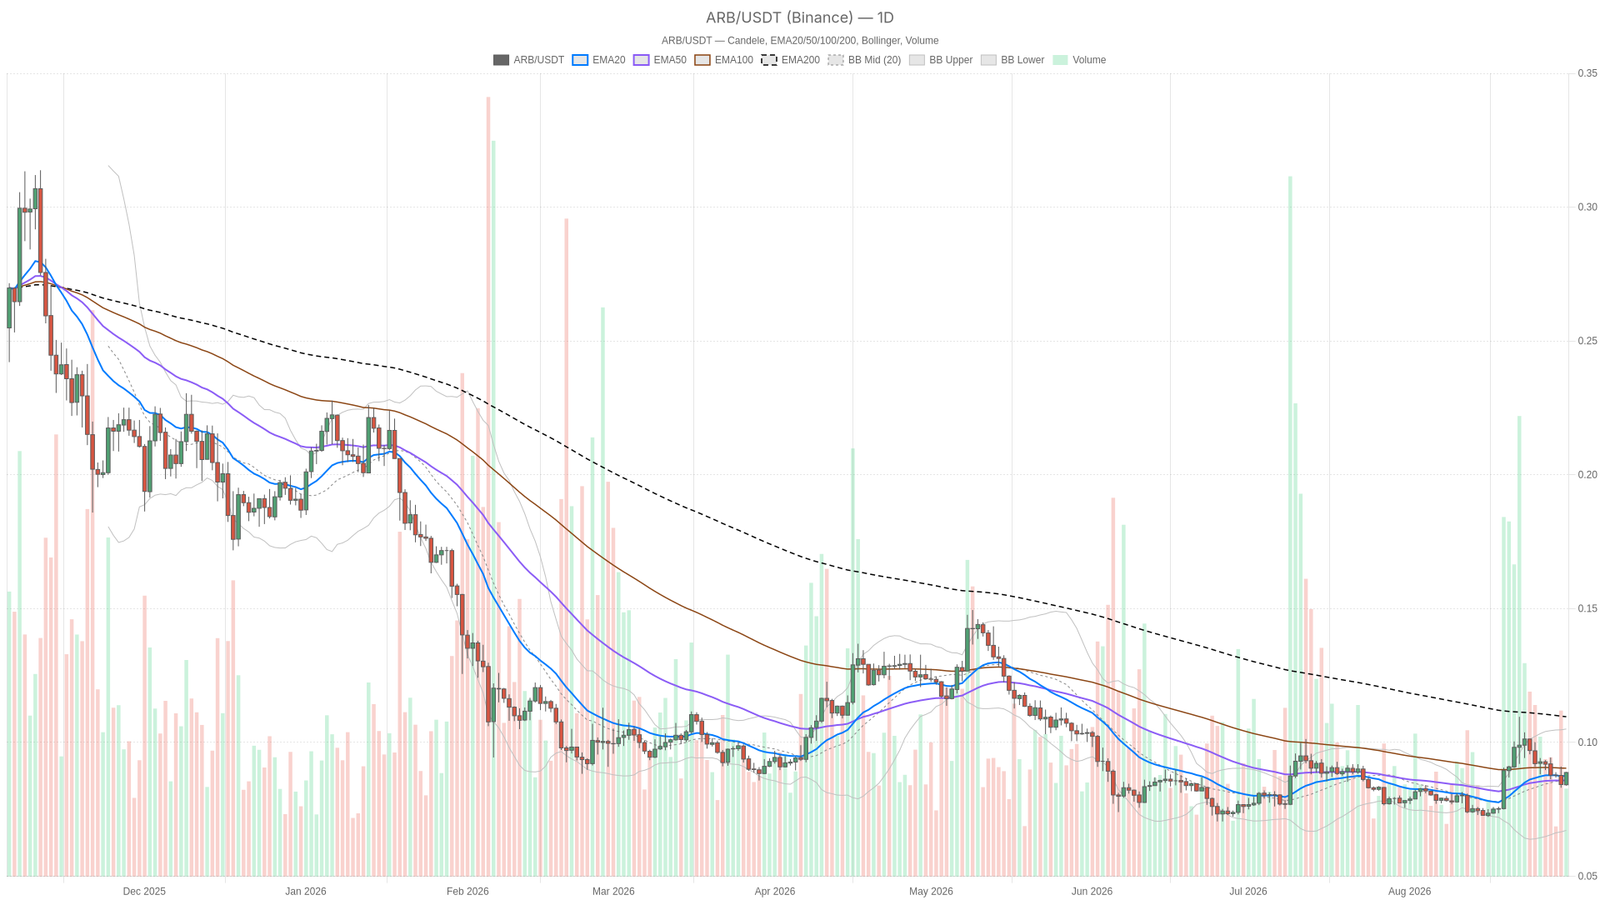
As of August 31, 2026, the Arbitrum crypto market finds itself in a holding pattern that reflects caution more than conviction. $ARB trades at $0.09, pinned on its 20- and 50-period daily EMAs yet still sitting well beneath its 200-day EMA at $0.11.
Key takeaways
- $ARB is trading at $0.09, pinned on its 20- and 50-day EMAs but remaining below the 200-day EMA at $0.11.
- Daily RSI reads 53.07 — barely above the midpoint — while MACD is flat across line, signal, and histogram, confirming neutral momentum.
- Bollinger Bands define a $0.07–$0.11 range, with price compressed at the mid-band in a classic coiling pattern.
- Intraday RSI on the 15-minute chart has reached 70.49 (overbought territory) without price breaking above the EMA cluster.
- Total crypto market capitalization fell 3% to roughly $2.66 trillion, while Bitcoin dominance climbed to 59.2%, creating headwinds for mid-cap altcoins.
Daily Structure Keeps the Bias Neutral
On the daily chart, RSI sits at 53.07 — barely above the midpoint — signaling that buyers and sellers are roughly balanced. MACD remains flat across line, signal, and histogram, meaning no directional thrust is building beneath the price. This is consistent with an asset that has stabilized after a decline but has not yet found a catalyst to reclaim higher ground.
The Bollinger Bands frame the range clearly: mid-band at $0.09, upper band at $0.11 — lining up almost exactly with the 200 EMA — and lower band at $0.07. Price sitting at the mid-band with EMA20 and EMA50 stacked at the same level is a classic compression signature. The market is coiled, not trending, and the next meaningful move will likely come from a break of one of those outer bands.
Momentum Diverges Across Timeframes
On the 1-hour chart, RSI jumps to 61.65, and on the 15-minute chart it pushes to 70.49 — solidly overbought intraday. However, EMA20, EMA50, and EMA200 are all clustered at $0.09 on both timeframes. Price has not actually separated from its moving averages despite the RSI heat. That tension is worth flagging: momentum is warming up on lower timeframes while the price structure has not confirmed it with a breakout.
Practically, this reads as a market where intraday buyers are stepping in and pushing RSI higher, yet without enough force to pull price meaningfully away from the EMA cluster. Moreover, if you are using the 15-minute chart for execution, an RSI near 70 with flat MACD serves as a caution flag. It is often where short-term rallies stall rather than accelerate.
Volatility and the Levels That Matter
ATR14 on the daily sits at $0.01, which is modest in absolute terms but represents roughly 11% of a $0.09 asset. That is enough room for the pair to test either Bollinger band without requiring a dramatic catalyst. However, daily pivot, R1, and S1 are all clustered tightly around $0.09, underscoring just how narrow the current consolidation zone is. There is not much daylight between support and resistance right now, which is precisely why neither bulls nor bears have taken control.
The Bullish Case
For Arbitrum crypto bulls, the setup requires price to clear and hold above the $0.09 EMA cluster on the daily and push toward the upper Bollinger Band at $0.11 — a level that overlaps with the 200 EMA. A daily close above that zone, paired with RSI extending past 53 and MACD turning positive, would provide the first real evidence that the long-term downtrend is being challenged. Until that happens, any strength on the 1H or 15m charts should be treated as tactical rather than structural.
This scenario gets invalidated if price rejects hard at $0.11 or if daily RSI rolls back under 50.
The Bearish Case
The bearish path is simpler: a failure to hold the $0.09 pivot sends price toward the lower Bollinger Band at $0.07. That risk increases if the broader market’s 3% pullback in total capitalization continues to drag capital toward Bitcoin. Flat MACD combined with price stuck below the 200 EMA is not a bullish combination — it reflects a market waiting for a reason to break down rather than up.
This view is invalidated the moment $ARB reclaims $0.09 with daily RSI pushing convincingly above the mid-50s and holding.
Sentiment and On-Chain Backdrop
The Fear & Greed Index reads 62, classified as Greed — a contradiction against a market that just shed 3% of total capitalization in a day. That divergence itself is a signal: sentiment has not caught up with the pullback yet. However, this can go either way. Either the drawdown is a buying opportunity sentiment is anticipating, or greed is lagging a rotation that has further to run.
On the DeFi side, fee data shows real dispersion in activity. Uniswap V3 fees jumped 473.05% in a single day even as its 7-day trend fell 15.9%, while Camelot V3 recorded a 143.52% daily fee spike against a 23.95% weekly decline. That kind of daily-versus-weekly split across decentralized exchanges indicates trading activity arrives in bursts rather than a sustained trend — mirroring exactly what $ARB’s chart displays: short bursts of momentum on lower timeframes that have not yet built into something structural on the daily.
Positioning Into the Next Move
None of this points to an obvious, low-risk trade. The daily chart is neutral, the higher timeframe trend remains below the 200 EMA, and intraday momentum on the 15-minute chart is already flashing overbought — three signals that do not align cleanly.
Anyone tracking $ARB right now should treat the $0.07–$0.11 range as the operative battlefield until a Bollinger Band extreme is tested with conviction. Volatility is compressed but not absent. Meanwhile, with the broader market showing a 3% daily contraction and Bitcoin dominance at 59.2%, the path of least resistance could shift quickly in either direction. This is a moment for patience and level-based thinking rather than chasing RSI spikes on shorter timeframes.
FAQ
What is $ARB’s current price and key resistance level?
$ARB is trading at $0.09, with its 200-day EMA at $0.11 acting as the primary resistance. The upper Bollinger Band also sits at $0.11, reinforcing that level. Support rests at the lower Bollinger Band of $0.07.
Is $ARB bullish or bearish right now?
The daily chart is neutral. RSI at 53.07 and flat MACD indicate neither buyers nor sellers have control. The asset sits below its 200-day EMA, which keeps the higher timeframe bias cautious, but the short-term structure has stabilized rather than broken down further.
What would confirm a bullish breakout for $ARB?
A daily close above $0.11 — the 200 EMA and upper Bollinger Band — paired with RSI extending past 53 and MACD turning positive would provide the first structural evidence of a trend reversal. Until then, intraday strength should be viewed as tactical rather than structural.
What is the bearish scenario for Arbitrum?
A failure to hold the $0.09 pivot opens the path toward $0.07, the lower Bollinger Band. This risk grows if Bitcoin dominance continues rising and total market capitalization keeps contracting, as capital rotates away from altcoins.
Disclaimer: This article is for informational purposes only and does not constitute financial advice, an investment recommendation, or a solicitation to buy or sell any financial instrument or cryptocurrency. The analysis provided is not indicative of future results. Investing in crypto assets and financial markets carries a high risk of capital loss. Always do your own research (DYOR) and consult a qualified financial advisor before making any decision.
Article produced with the assistance of artificial intelligence and reviewed by the editorial team.