The Black Bull trades at $0.2419 on July 11, down 1.35%, consolidating above an ascending trendline after one of the most violent meme coin corrections in recent Solana history.
Is $ANSEM Finding Support After Its KuCoin Crash?
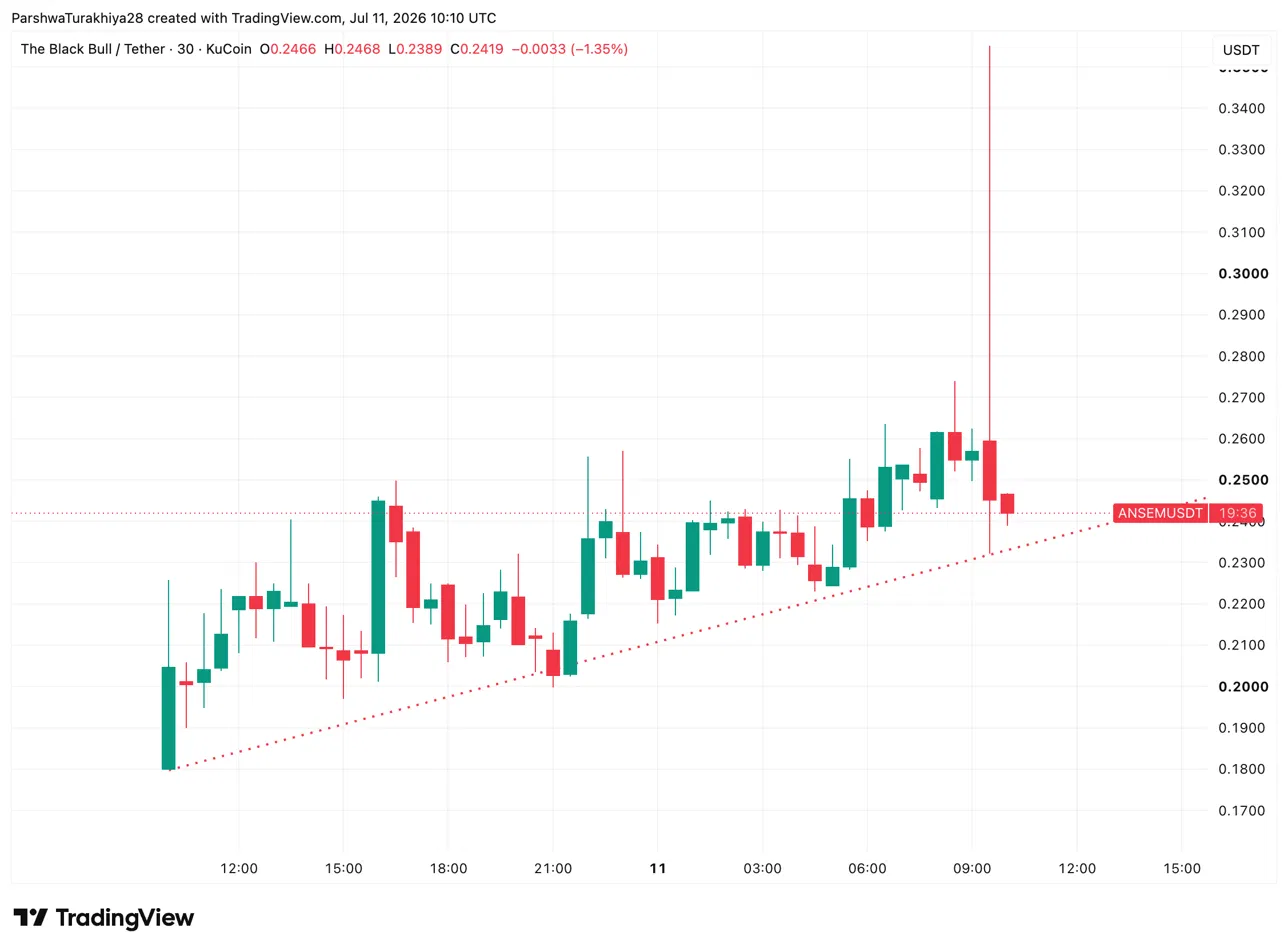
The 30-minute chart shows $ANSEM bouncing off an ascending trendline that has held since the July 10 low near $0.18, with price working its way back toward $0.25 in a choppy recovery. A sharp wick to $0.35 on July 11 attracted immediate selling that dragged the price back to $0.24, suggesting heavy overhead supply from holders who bought during the rally and are using spikes to exit.
Price needs to stay above the dotted trendline support near $0.21-$0.22 to keep any short-term structure alive. Losing that level puts the July 10 low near $0.18 back in play.
What Are The Key Support And Resistance Levels For $ANSEM Today?
- Support at the ascending trendline near $0.21 and the $0.18 low
- Resistance at $0.27 intraday high and the $0.35 spike zone
How Did $ANSEM Go From Zero To $449M In Under A Month?
$ANSEM launched on Pump.fun in mid-June 2026 with no product, no team, and no roadmap. An anonymous deployer spent $6,300 to create the token, then sent 650 million or about 65% of the supply directly to the wallet of Zion Thomas, known online as Ansem. The deployer sold the remainder for just $5,500, capturing almost none of the upside.
Ansem didn’t create it, but he didn’t walk away either. He leaned into the community that had already formed around his name, and between June 27 and 29, airdropped roughly $7M worth of $ANSEM from his Pump.fun creator fees directly to holders, explicitly targeting growth from 25,000 wallets to 1 million. The token surged more than 190,000% in 13 days, briefly hitting above $440M market cap and generating a paper gain of over $193M for Ansem’s wallet in a single week, according to Lookonchain.
Why Did $ANSEM Drop 45% From Its All-Time High?
Two things hit simultaneously. KuCoin listed $ANSEM on July 10, giving early holders who had been sitting on massive unrealized gains a liquid, centralized venue to exit. $ANSEM fell more than 45% from its all-time high of $0.44, as early investors took profits. The listing pushed 24-hour volume to $99.75M, a 96% spike, but most of that volume was selling rather than buying.
The second factor was $CASHCAT on Robinhood Chain absorbing meme coin liquidity. Robinhood CEO Vlad Tenev’s comment endorsing memes on Robinhood Chain shifted trader attention, and multiple on-chain trackers noted capital rotating out of Solana meme coins toward the new narrative. A wallet linked by on-chain analysts to Ansem spent around $233,000 buying $CASHCAT around the same time, though Ansem has not confirmed the wallet belongs to him.
Related: Cash Cat Price Prediction: Is $CASHCAT’s 355% OI Spike the Start of Something or the Top
What Are The Biggest Risks With $ANSEM Right Now?
Supply concentration is the most visible structural risk. One wallet controls more than 60% of $ANSEM’s total supply, which RugCheck flags as a manipulation risk. That holder can sell into any rally without any obligation to disclose timing.
On-chain investigator ZachXBT has also publicly accused Ansem of pump-and-dump promotion tied to Solana meme tokens, an allegation that keeps cautious capital away regardless of price action. Staking has been paused pending a security audit. A fake airdrop scam site at blackbullsolclaim[.]pro is also circulating, targeting $ANSEM holders with wallet drainers.
$ANSEM Price Prediction: Upside and Downside Targets
- Upside case: The ascending trendline holds, Ansem’s planned liquidity pool funding reduces sell pressure, and $ANSEM retests $0.30-$0.35 as the Solana meme narrative stabilizes.
- Downside case: The trendline breaks, early holders continue using KuCoin liquidity to exit, and $ANSEM slides back toward $0.15 as $CASHCAT continues pulling meme coin capital toward Robinhood Chain.