
A popular crypto analyst believes Shiba Inu could be approaching a major technical turning point after spending years trading beneath a key descending resistance trendline.
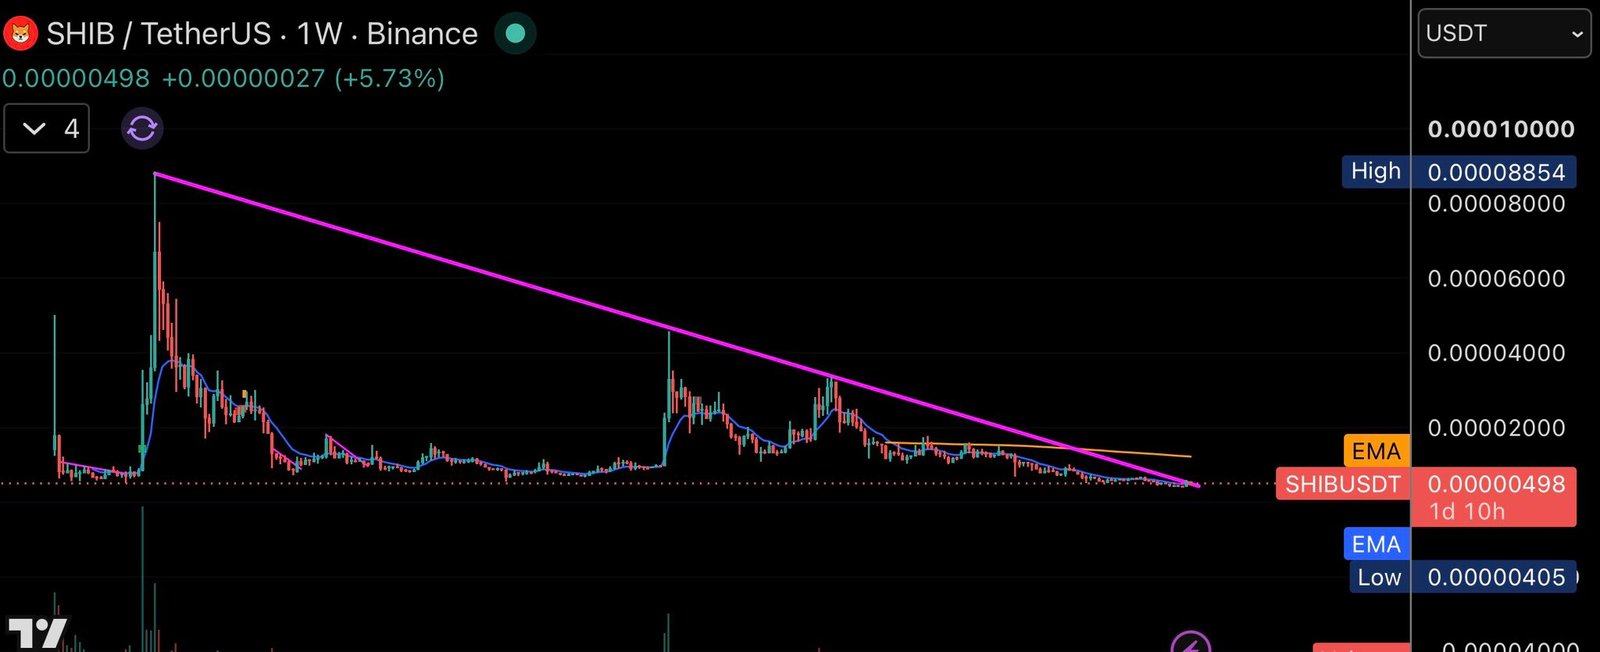
Sharing daily and weekly Binance $SHIB/USDT charts, analyst Eunice Wong argued that Shiba Inu has built a long-term bottoming structure and is now attempting to break above the descending trendline that has capped every major rally since the token reached its all-time high in 2021.
The weekly chart shows that $SHIB is approaching the descending resistance that has constrained its price action since it peaked at $0.00008854 in October 2021. Every meaningful recovery attempt over the past few years has failed to reach this level, creating a series of lower highs throughout the prolonged bearish trend.
Currently trading around $0.00000498, $SHIB sits near the point where price meets the multi-year trendline. The prolonged consolidation around historical support has strengthened the case for a potential bottom.
Daily Chart Shows Improving Bullish Momentum
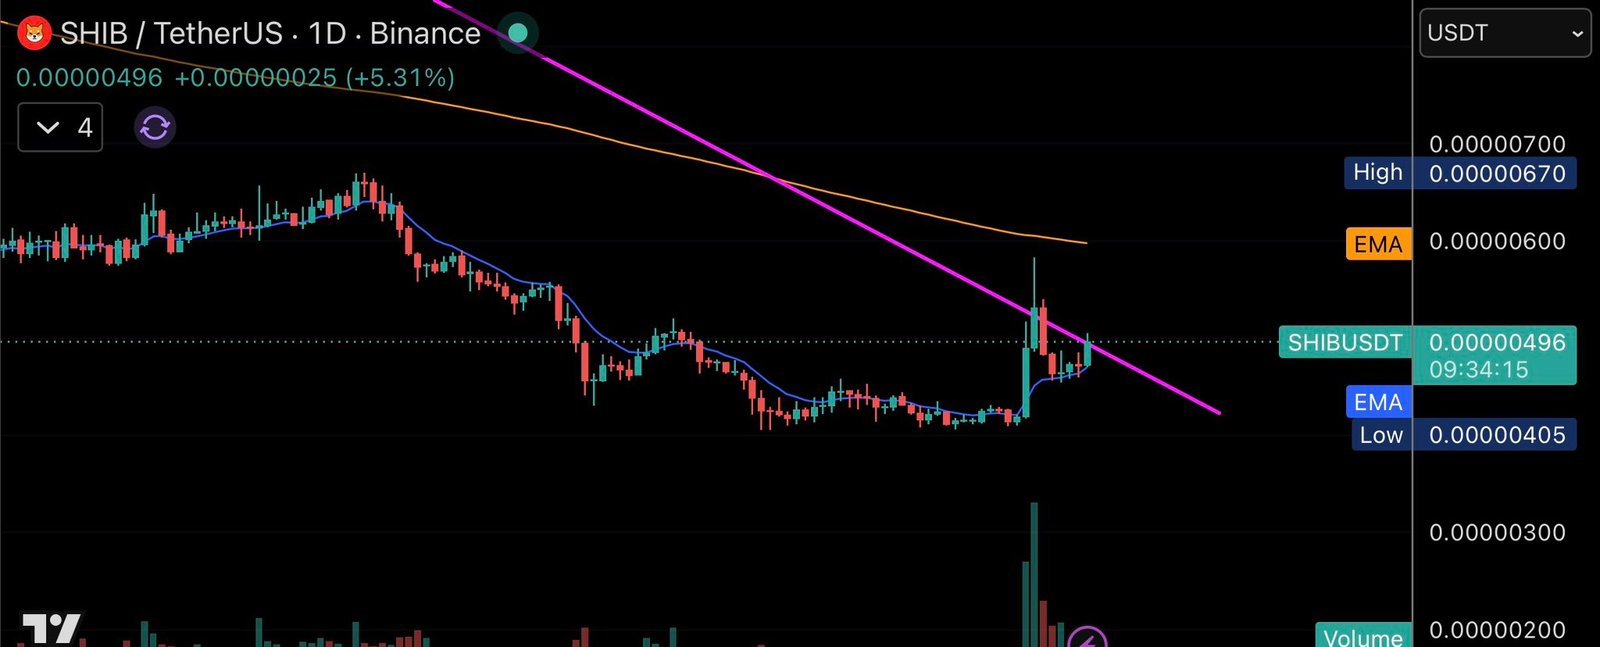
The daily timeframe also points to improving market sentiment.
After bottoming near $0.00000405 in June, $SHIB rebounded to $0.00000596 last week before briefly pulling back. Buyers quickly stepped back in, pushing the token toward the same resistance zone highlighted on the weekly chart.
$SHIB has recovered roughly 22% from its recent low near $0.00000402, with rising volume accompanying the initial rally, indicating stronger market participation. Even so, the token continues to trade below a key long-term exponential moving average, suggesting additional resistance could emerge even if it clears the descending trendline.
Rather than forecasting an immediate rally, Wong emphasized that $SHIB’s breakout could develop gradually. The token may need additional time to build enough momentum to overcome a resistance level that has remained intact since the 2021 market peak.
Double-Bottom Pattern Hints at Shiba Inu Potential Surge to $0.00000520
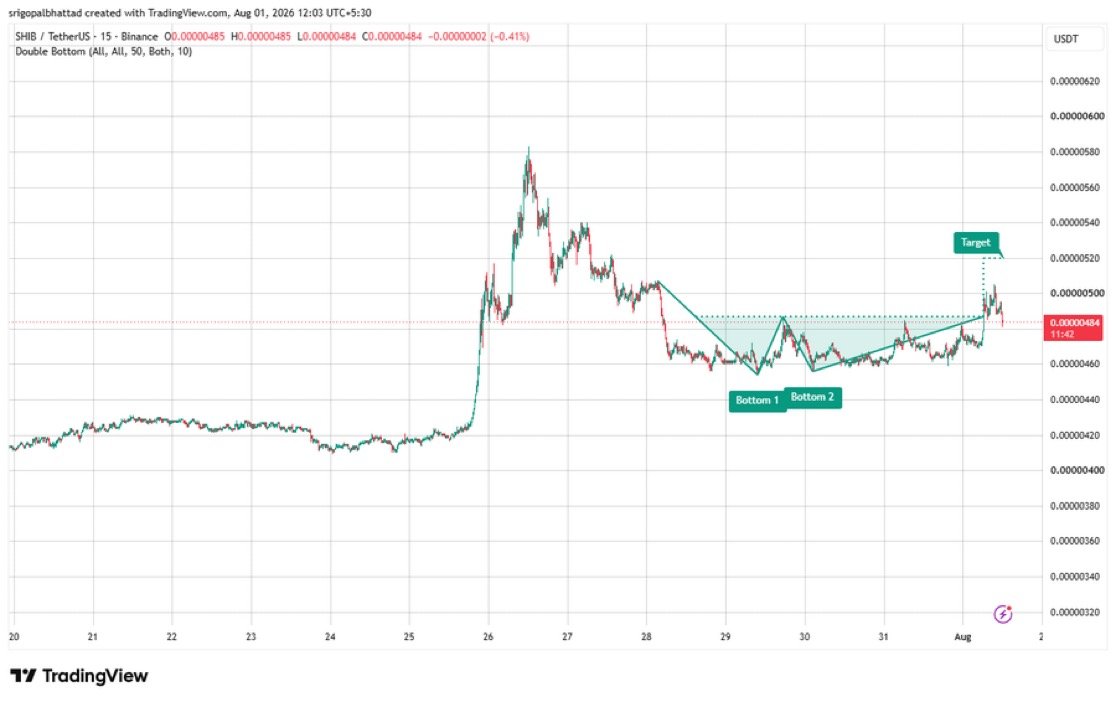
Adding to the optimistic outlook, another market analyst, BuddyKing, believes $SHIB is forming a potential double-bottom pattern.
According to the analysis, buyers have consistently defended the $0.00000455–$0.00000460 support zone while the token challenges the $0.00000485–$0.00000490 neckline. A confirmed breakout above that resistance could pave the way for a move toward $0.00000520.
Although momentum appears to be gradually shifting in favor of the bulls, BuddyKing stressed that confirmation remains essential before anticipating the next leg higher.
 Meanwhile, $SHIB continues to hold onto part of last week’s strong rally, during which it briefly climbed to around $0.000006. It is up 9.87% over the past month, although it has slipped 5.16% over the past week.
Trading activity has also slumped, with daily volume falling 44.83% to $90.67 million, indicating that traders are waiting for clearer confirmation before committing to the next major move.