
Aave V4 went live on the Arc Layer-1 network on Sept. 16 and attracted $USDC almost immediately. By Sept. 17, point-in-time Aavescan data showed roughly $76 million supplied, less than $100,000 borrowed, and utilization near 0.1%.
Suppliers quickly filled the market’s initial capacity, but borrowers had put almost none of that liquidity to work.
LlamaRisk responded to the deposit rush by proposing an increase in the Arc Main Spoke’s $USDC add cap from 56 million to 150 million tokens. The balance later moved above the former ceiling, showing that 56 million was no longer binding.
However, the governance post and live market page did not identify the exact replacement setting as executed.
What Arc’s full cap actually measured
Aave V4 organizes liquidity through hubs and spokes. A hub holds liquidity, while spokes define how users interact with it. An add cap limits how much of an asset a spoke can supply into its hub.
Aave’s technical analysis describes them as the V4 equivalents of supply and borrow caps.
Arc’s Main Spoke launched with a 56 million $USDC add cap and a 51 million $USDC draw cap. LlamaRisk reported that the add cap reached 100% within hours, with 56 million $USDC valued at about $55.99 million in its Sept. 16 snapshot.
The launch figures separate supply-side capacity from credit use:
Measure Launch or Sept. 17 reading Signal Initial Main Spoke add cap 56 million $USDC Maximum supply through the spoke Main Spoke draw cap 51 million $USDC Maximum borrowing through the spoke $USDC supplied Roughly $76 million Liquidity deposited into Arc Core V4 $USDC borrowed Less than $100,000 Credit drawn from that liquidity $USDC utilization About 0.1% Share of liquidity in use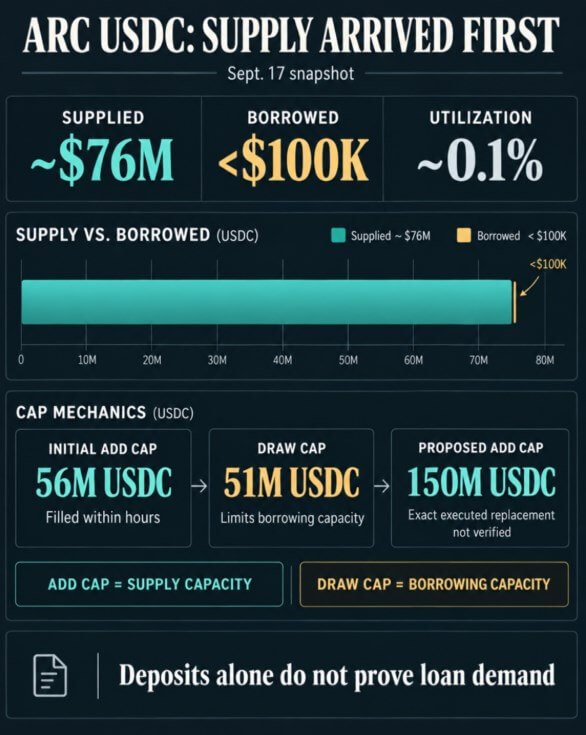
This also explains why Aave’s broader V4 deposit figures cannot be treated as Arc growth alone. LlamaRisk said deposits increased from $577.1 million to $708.6 million between its Round 16 and Sept. 16 snapshots, but that total covered six hubs.
Arc Core accounted for about $57.56 million at that point, and the later Aavescan reading was both newer and specific to Arc’s $USDC balance.
Related ReadingCircle processed $32 trillion in $USDC transfers, yet 95% of its revenue relies entirely on interest rates
Aave’s interest-rate framework prices hub liquidity according to utilization. When little capital is borrowed, liquidity remains abundant, and base rates stay low. The Arc snapshot fit that pattern: Aavescan displayed 0.00% supply and borrow APRs during Sept. 17 checks.
Those displayed rates describe the protocol view at that moment, while public launch data did not disclose whether separate rewards existed or whether a few addresses supplied most of the $USDC.
Borrowing is now the adoption test
More add-cap capacity gives deposits room to grow, but the proposed move to 150 million $USDC would nearly triple the original supply-side ceiling while leaving the 51 million $USDC draw cap unchanged.
It would expand the amount of $USDC that could enter through the Main Spoke without increasing the maximum that could be borrowed through it.
The next evidence of adoption will come from the demand side: a sustained rise in borrowed $USDC, utilization, and rates.
If those measures increase as capacity expands, Arc will be developing into an active credit market. If they stay near launch levels, the market will remain a large pool of mostly idle liquidity.
More room for deposits can improve the market’s ability to serve future borrowers, but only actual draws can show whether users value that capacity as credit rather than as a place to park $USDC.
For now, Arc has not yet proved that borrowers will follow the $USDC liquidity it attracted.