
While the token slipped 1.6% over the past 24 hours to trade around $94.35, the broader trend remains intact after a 22.8% gain over the last 30 days.
The latest price action has shifted attention to the $100-$105 region, where several analysts believe the next major trend will be decided.
$AAVE approaches key breakout zone after strong monthly recovery
Despite the latest pullback, $AAVE has continued to build a series of higher lows, a pattern that often reflects steady buying interest.
Over the past week, the token gained more than 4%, even as the broader cryptocurrency market struggled with risk-off sentiment.
The recent decline appears to have been driven largely by market-wide weakness rather than protocol-specific developments.
Bitcoin also traded lower during the same period, while the total crypto market lost roughly 1.3%, weighing on large-cap altcoins including $AAVE.
At the same time, $AAVE's trading volume dropped by more than 25% to approximately $169.5 million, indicating that buyers have yet to return aggressively.
The crypto market's Fear & Greed Index remained at 35, reflecting a cautious environment that has limited momentum across digital assets.
From a technical perspective, $AAVE continues to hold above its 10-day, 20-day, 50-day, and 100-day exponential moving averages (EMAs), maintaining a bullish short- to medium-term structure.
The only major trend barrier still overhead is the 200-day moving average, which sits close to the broader $105 resistance area.
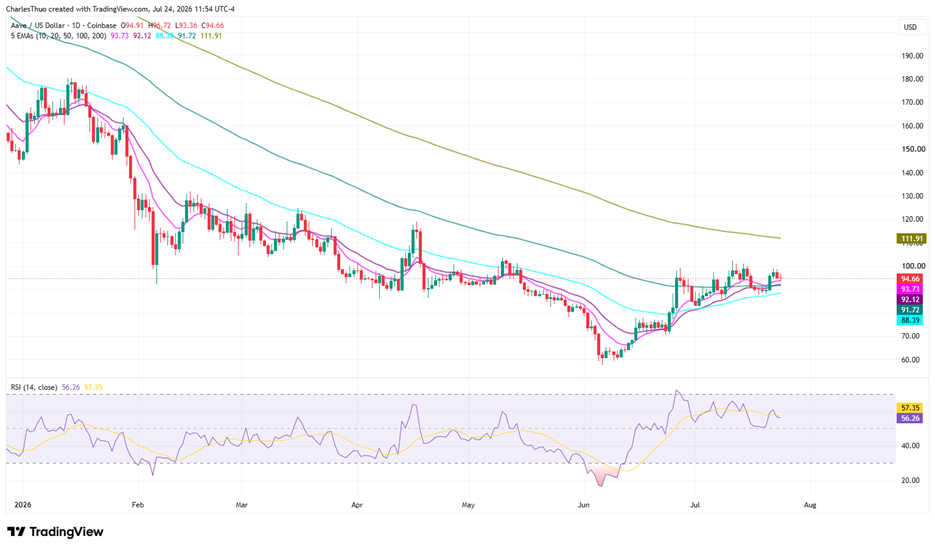
Momentum indicators also remain balanced. The 14-day Relative Strength Index (RSI) stands at 56.26, a neutral reading that suggests the market is waiting for a fresh catalyst before committing to the next directional move.
$100 and $105 remain the levels to watch
Price action over the coming sessions is likely to revolve around a relatively narrow trading range.
The first resistance sits at $97.92. A daily close above that level would strengthen the current uptrend and open the door for a test of the psychological $100 mark.
Beyond that, the next important resistance stands near $100.65, followed by the longer-term barrier around $105.
On the downside, immediate support is located around $94.60, which has become an important level because of concentrated liquidation activity.
If buyers fail to defend that area, price could quickly revisit the next liquidity zone near $93.80.
A stronger support level sits at $92.44. Losing that level on a daily closing basis would weaken the current bullish structure and increase the probability of a deeper retracement toward the $90 demand zone.
Analysts outline targets of $125 and $141
Several well-known crypto analysts are focusing on the same breakout levels despite having different upside targets.
Michaël van de Poppe recently said $AAVE appears "primed for a strong breakout upwards," pointing to the formation of consistent higher lows beneath resistance.
According to Michaël’s analysis, continued demand below resistance increases the probability of an upside move, with $125 serving as his next major target if the breakout is confirmed.
Crypto Patel also maintains a bullish outlook but approaches the chart from a different perspective.
He believes $AAVE continues to respect a higher-timeframe bull flag that developed after the token rebounded from channel support near $88.
According to Patel, the pattern would only be confirmed after a decisive breakout above $105. If that happens, the measured move from the bull flag projects a potential advance toward $141.
However, Patel also notes that failure to reclaim $105 could send the token back toward the $90 demand zone before the next major move develops.
Although the upside targets differ, both analysts identify the same technical area as the point where bullish momentum would gain stronger confirmation.