As of August 1, 2026, $AAVE/$USDT trades at $92.09, with the Aave crypto market caught between a neutral daily structure and bearish hourly signals. Broader crypto weakness adds pressure, keeping price action contained in a narrow range.
Key takeaways
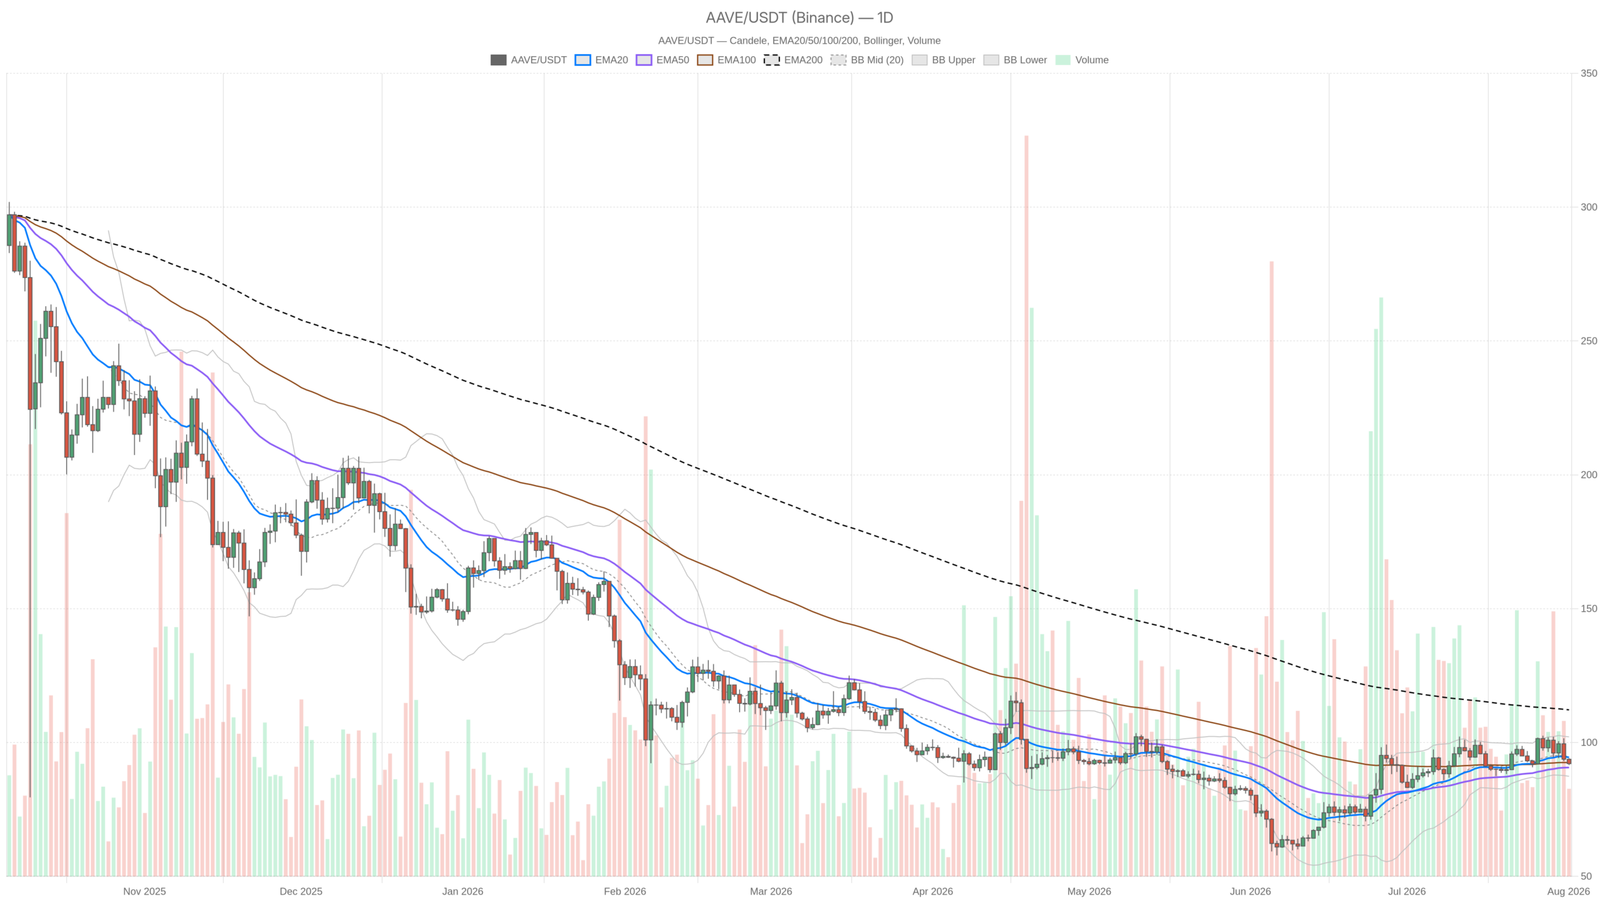
- $AAVE/$USDT trades at $92.09 on August 1, 2026, sitting below the daily EMA20 at 94.46 and nearly 18% under the EMA200 at 112.2.
- Daily RSI at 48.47 signals neutral momentum, while hourly RSI at 30.08 leans oversold, creating a clear timeframe disagreement.
- The Fear & Greed Index reads 27 and Bitcoin dominance sits at 56.2%, reflecting broader risk-off sentiment across crypto markets.
- Key levels to watch: support at S1 91.05, resistance at R1 93.63 and the daily EMA20 at 94.46.
- Daily ATR of 5.21 signals elevated volatility potential despite compressed intraday ranges on lower timeframes.
Daily Bias: Neutral, But Structurally Damaged
The daily chart has stalled rather than reversed. Price closed at $92.09, sitting below the EMA20 at 94.46 and EMA50 at 90.65, while the EMA200 at 112.2 remains nearly 18% above current levels. That gap is a classic footprint of a market still in a broader downtrend, even as the immediate slope flattens. The daily regime is labeled neutral precisely because momentum has cooled without turning bullish.
Daily RSI at 48.47 reinforces this ambiguity, hovering near dead center with no clear directional conviction. The daily MACD line at 1.92 sits below its signal line at 2.52, and the histogram at -0.6 suggests the bounce from recent lows has lost fuel before confirming any real trend change. It is not a collapse signal, but it is not a green light either.
Bollinger Bands frame the trading range clearly: the mid-band sits at 94.74, the upper band at 102.11, and the lower band at 87.38. With price closer to the midline than either extreme, no volatility squeeze is forcing a breakout yet. However, the daily ATR at 5.21 confirms this remains a market with real movement potential, meaning position sizing deserves extra attention here.
Hourly and 15-Minute Timeframes Tell a Weaker Story
The tension between timeframes sharpens considerably on lower charts. On the 1H, $AAVE trades below its EMA20 at 94.65, EMA50 at 96.4, and EMA200 at 96.52, forming a fully stacked bearish EMA structure. The regime flag reads bearish, and RSI at 30.08 knocks on oversold territory. That cuts both ways: it can mean sellers are exhausted, or it can mean the drop simply has not found its floor yet.
The 1H MACD line at -1.59 versus a signal of -1.31, with a negative histogram of -0.28, confirms momentum still points downward on this timeframe. Meanwhile, the 15-minute chart mirrors that weakness. EMA20 at 92.82, EMA50 at 94.08, and EMA200 at 96.75 all stack above spot price, while RSI at 35.48 keeps the short-term bias tilted lower. Interestingly, the 15m MACD histogram has flattened to a razor-thin 0.02, hinting that intraday selling pressure may be easing right at this moment, though not enough to flip the broader picture.
The core disagreement is clear: the daily chart says stalled but not broken, while the 1H and 15m charts say actively weak. When timeframes conflict like this, lower timeframes typically win in the short run. That said, the daily structure is what ultimately decides whether any bounce actually sticks.
Pivot Levels and Volatility Context
Daily pivots place the pivot point at 92.59, with resistance at R1 at 93.63 and support at S1 at 91.05, creating a tight band that price has been orbiting. On hourly and 15-minute timeframes, the pivot compresses even further: PP at 92.09, R1 at 92.26, and S1 at 91.93. This tells you intraday traders are working inside a very narrow box right now. The 1H ATR of 1.14 and 15m ATR of 0.45 confirm volatility has contracted noticeably compared to the daily range, producing a coiled-spring setup that often precedes a directional move once one side of the range gives way.
Broader Market Context: Risk-Off Mood Weighs on DeFi
The macro backdrop is not helping. Bitcoin dominance sits at 56.2%, and with the Fear & Greed Index at 27, capital is not exactly rushing into altcoins or DeFi tokens. On-chain data reinforces this caution. According to DefiLlama fee figures, major DEXs are seeing sharp compression. Curve DEX fees dropped 97.52% in the last 24 hours and 95.3% over seven days, while Uniswap V4 fees fell 36.34% weekly. Even Uniswap V3, the largest by all-time fees, saw a 17.67% daily drop. Fluid DEX and Ekubo were among the few showing daily upticks, but the broader DeFi trend is clearly cooling. Since Aave’s protocol revenue depends directly on DeFi liquidity and borrowing demand, this activity slowdown represents a headwind worth watching alongside the price chart.
Bullish Scenario
For Aave crypto bulls, the path forward requires reclaiming the daily EMA20 at 94.46 with conviction. Ideally, the 1H RSI should lift decisively out of the 30 zone rather than merely bouncing off it. A push through daily R1 at 93.63 that holds as support, rather than resistance, would be the first real sign that the neutral daily structure is tilting back to bullish. This scenario gets invalidated if price fails repeatedly at the 92.5 to 93.6 zone and rolls back below S1 at 91.05, confirming sellers still control the tape despite oversold hourly readings.
Bearish Scenario
The bearish case is arguably the path of least resistance right now, given the stacked EMA structure on both the 1H and 15m charts. A break below daily S1 at 91.05, with the 1H MACD histogram staying negative, would open the door toward retesting the lower Bollinger Band near 87.38 on the daily chart. This scenario gets invalidated if the 15m MACD histogram, currently flattening near zero, turns positive and hourly RSI climbs back above 40, signaling that selling pressure has genuinely dried up rather than just paused.
Where This Leaves Traders
$AAVE sits in a market that has not made up its mind. The daily chart has stopped bleeding but has not turned the corner, while shorter timeframes actively price in more downside before any bounce gets taken seriously. Add a broader crypto market under mild pressure, with total market cap down 1.46% in 24 hours, and the setup calls for patience over conviction in either direction. Volatility remains elevated on the daily at ATR 5.21 even as intraday ranges compress, often the calm before a larger move. Traders should size positions with that asymmetry in mind and let price confirm a break of either the 91.05 support or the 93.63 to 94.46 resistance zone before assuming the next leg has started.
FAQ
What is $AAVE’s current price and what does the daily chart show?
As of August 1, 2026, $AAVE/$USDT trades at $92.09. The daily chart displays a neutral structure, with RSI at 48.47 near dead center, price sitting below the EMA20 at 94.46, and the EMA200 at 112.2 nearly 18% above current levels, indicating a broader downtrend remains in play.
Why are the hourly and daily timeframes sending conflicting signals?
The daily chart shows stalled momentum through neutral RSI and a flattening MACD, while the 1H chart displays a fully bearish EMA stack with RSI at 30.08 near oversold territory. This disagreement typically resolves with lower timeframes leading in the short term, while the daily structure determines whether any reversal actually holds.
What are the critical support and resistance levels to watch?
Key support sits at S1 91.05, with a break below that level opening the path toward the lower Bollinger Band at 87.38. On the upside, resistance stands at R1 93.63 and the daily EMA20 at 94.46. Reclaiming this zone with conviction would be the first meaningful bullish signal for the Aave crypto market.
Disclaimer: This article is for informational purposes only and does not constitute financial advice, an investment recommendation, or a solicitation to buy or sell any financial instrument or cryptocurrency. The analysis provided is not indicative of future results. Investing in crypto assets and financial markets carries a high risk of capital loss. Always do your own research (DYOR) and consult a qualified financial advisor before making any decision.
Article produced with the assistance of artificial intelligence and reviewed by the editorial team.