
- $ONDO is currently trading around the $0.41 mark.
- Buyers are in clear control of short-term price action.
The broader crypto market sentiment is fear, and the digital assets are found in both red and green across the board. Meanwhile, the token $ONDO is currently trading at $0.4138, up 2.87%, with the trading volume climbing 10.82% to $134.78 million. Moreover, this session has ranged between a low of $0.3911 and a high of $0.4218.
$ONDO is attempting to break out of a falling wedge, a pattern that historically resolves to the upside. A daily close above $0.4218 confirms the breakout and triggers the potential bullish setup within the market. Without that close, the trading pattern of the asset remains unconfirmed regardless of the intraday moves.
If the above-mentioned breakout is confirmed, the next crucial target of $ONDO sits at $0.70, which is a significant 66% move from the breakout level.
What Is $ONDO’s Short-Term Technical Momentum Signalling?
The $ONDO/USDT trading pair shows a bullish turn on the four-hour charts. With the recent gain in value, the momentum could push the price to the resistance at around $0.4161. If the mighty bulls persist, the golden cross could emerge and likely send the price above $0.4184.
On the contrary, if the price pattern prints a red graph, it is typically a negative signal. The immediate support of $ONDO would be at $0.4115. A failure to hold this level could invite a strong downside correction, followed by the formation of the death cross, pushing the price below $0.4091.
$ONDO’s technical chart reports that the MACD line is above the signal line, with the short-term buying momentum is accelerating. As both lines are above zero, the broader trend is strongly bullish, and the buyers dominate the overall market structure.
The asset is in a healthy, high-conviction markup phase. Traders consider this a prime trend. If the lines get excessively stretched far above zero, it can signal the trend is getting overextended.
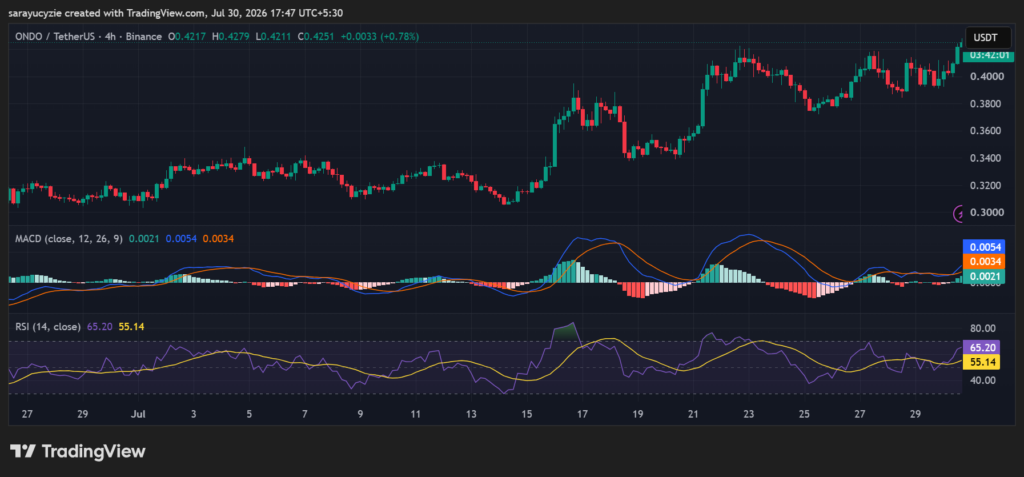
The ongoing market sentiment of $ONDO is strongly bullish, with the RSI value at 65.20, approaching the overbought boundary. Buyers are in clear control of short-term price action, driving a healthy uptrend.
The momentum is powerful; the indicator is creeping closer to the 70 line, where assets start to become overextended. The market is showing strong buying strength with a solid upward push. Traders view this as a healthy continuation zone.